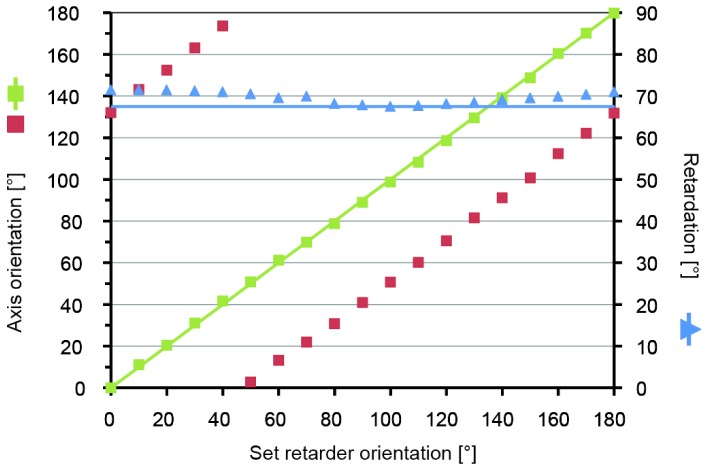
Fig. 2.
Plot of measured axis orientation (scaled according to ordinate on the left) and retardation values (scaled according to ordinate on the right) versus set retarder orientation: averaged axis orientation values (red squares); unwrapped and offset subtracted axis orientation values (green squares); expected axis orientation values (solid green line); averaged retardation values (blue triangles); expected retardation values (solid blue line)

