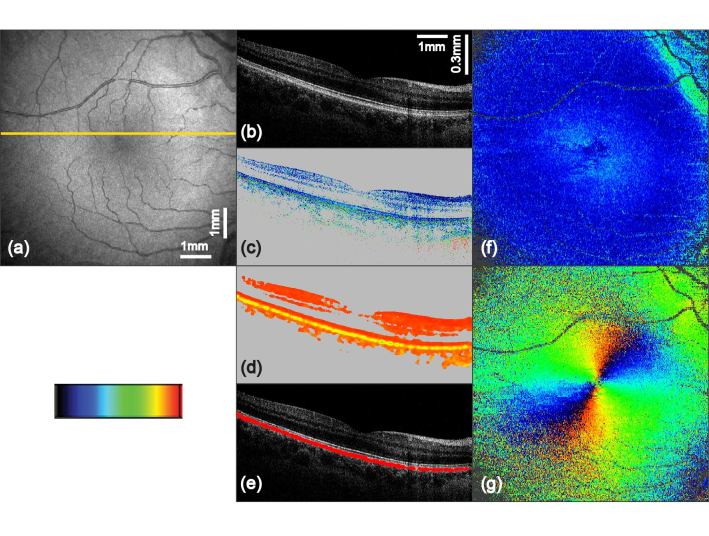
Fig. 3.
PS-OCT imaging results of the macula region from a healthy human volunteer (scan angle 25° × 25°, scan pattern 1024 × 256 A-scans). The yellow line in (a) indicates the position of the corresponding B-scans in (b) to (e): (a) fundus projection image; (b) intensity B-scan on logarithmic gray scale; (c) retardation image (color scale 0° to 30°); (d) DOPU image (color scale 0 to 1); (e) overlay of segmented depolarizing structures (red) with the intensity image; (f) 2D en face retardation map retrieved at IS/OS and ETPR (color scale 0° to 30°); (g) 2D en face axis orientation map retrieved at IS/OS and ETPR (color scale −90° to + 90°)

