Fig. 3.
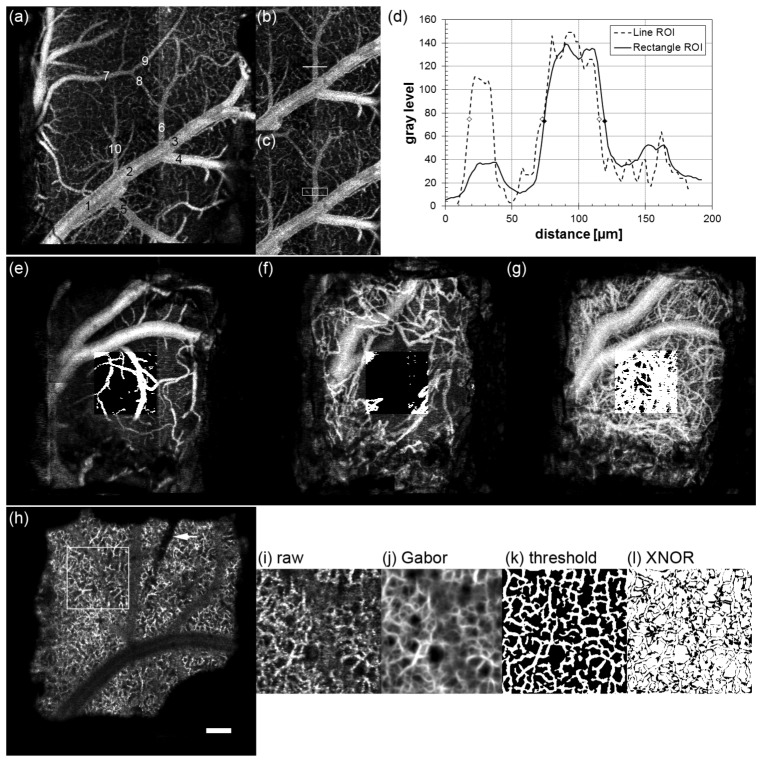
Illustrated methodology to quantify cortical vascular dynamics, including vasodilation (a-d), vessel growth (e-g), and capillary remapping (h-l). (a) OCA image plane 100-200 µm for control animal W44 indicating 10 profile locations. (b,c) Line and rectangle ROIs for location 6. (d) Single (dashed line) and 30-line average (solid line) profiles across location 6. Symbols indicate FWHM values. OCA image plane 0-100 µm for control animal W38 for 1 (e), 8 (f) and 27 (g) dps. Thresholded ROI is overlaid on each image. (h) OCA image plane 300-400 µm for electrode animal W51 on 1 dps. ROI is indicated as well as electrode location (arrow). Similarity processing: (i) ROI (day 26), (j) Gabor filtered image, (k) local thresholded image, and (l) XNOR image between day 26 and day 34. Scale bar = 200 µm.

