
Fig. 5.
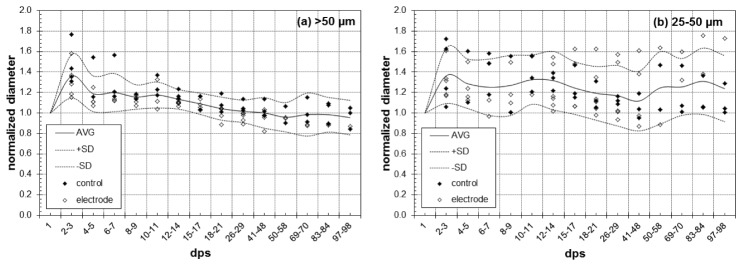
Normalized vessel diameter in (a) large and (b) medium vessels measured with OCA. Control and electrode animals are indicated by filled and open symbols and the average and standard deviation of all data is indicated by lines. Each data point represents an average of five profiles for that animal and day.