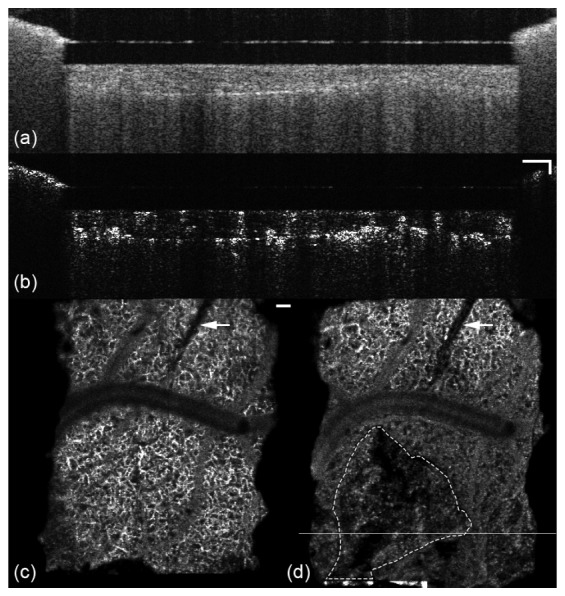
Fig. 9.

Cross-sectional reflectance (a) and angiography (b) images of a lesion in animal W49. En face angiography images from the 300-400 µm depth plane are shown in (c) and (d) for day 1, before formation, and day 50. Line in (d) indicates location of B-scan in (a) and (b). Electrode is denoted by arrow and lesion margin with dashed line. Accompanying video (Media 5 (2MB, MOV) ) shows the growth in 0-200 µm and 300-400 µm depth planes. Scale bars = 100 µm.
