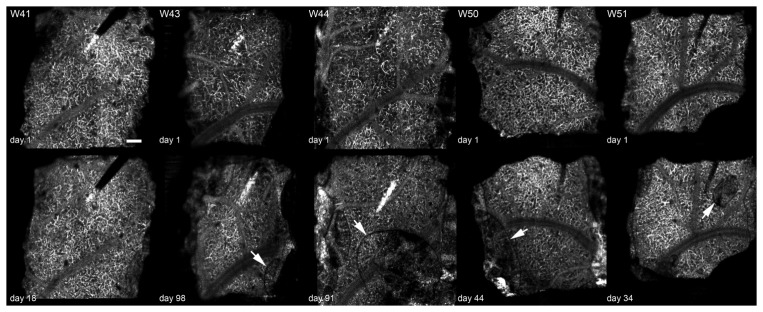
Fig. 10.

En face angiography images 300-400 µm below cortical surface for electrode animals W41, W43, W44, W50, and W51. W41 showed no growth. In the others, the growth is indicated by an arrow. Upper row shows vasculature on day 1 before new growth and lower row show vasculature after lesion formation (dps indicated). Each image is 2 × 2 mm. Scale bar = 200 µm.
