
Figure 2.
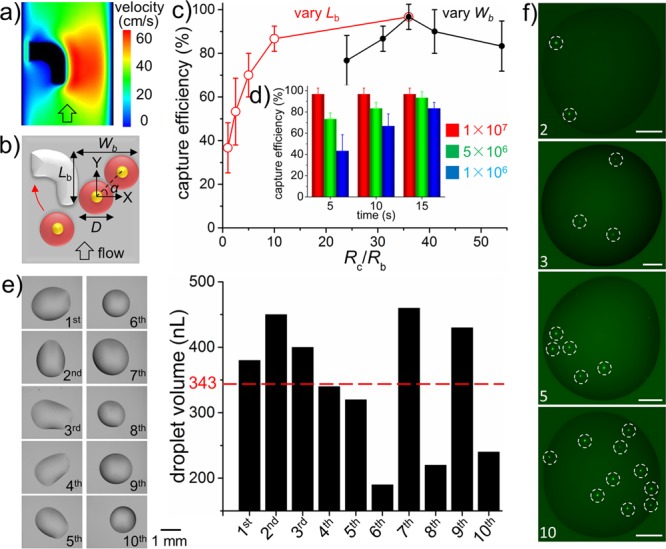
Optimization and characterization of hSCP for single-cell manipulation. (a) Numerical simulation of flow profile around the hook. (b) Model of single-cell capture by hook. Wb, width of bypass path; Lb, length of bypass path; D, diameter of cell. Single-cell capture efficiency under various fluid-resistance ratios (Rc/Rb) (c) as well as aspiration times and cell concentrations (d). Rc, fluid resistance of capture path; Rb, fluid resistance of bypass path. (e) Single-cell droplet volume evaluation. The average value (343 nL) is indicated by the red dotted line. (f) Quantitative single-cell isolation including 2, 3, 5, and 10 cells. The single cells are indicated by white dotted circles. Cells are SK-BR-3 (b–d) and MDA-MB-231/GFP (e–f). Scale bar, 200 μm.