
Figure 3.
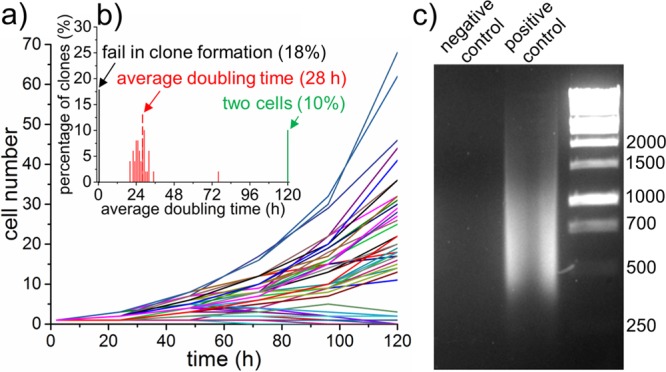
Single-cell cloning and PCR. (a) Cell numbers per clone versus time. (b) Distribution of average doubling time of clonal cells. Only cell numbers over 2 are calculated. (c) Analysis of 2% whole-genome DNA amplification from a single cell after 25 cycles. MDA-MB-231/GFP cells were used.