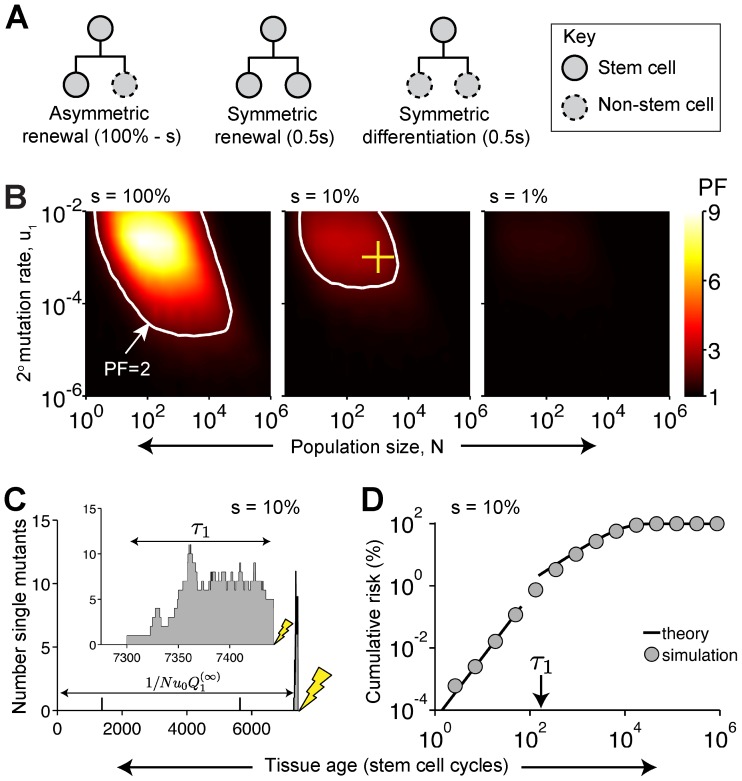
Figure 4. Modest amounts of symmetry can provide significant protection.
(A) A fraction s of stem cells divide symmetrically while the others divide asymmetrically. (B) Protection against the accumulation of two mutations. Lifetime is L = 103 stem cell cycles and mutation rate is u0 = 10−6. (C) Typical dynamics, with blow-up of the last few cell cycles (inset). Horizontal arrows indicate the mean time that a single-mutant lineage drifts before mutating, Eq. (S30), and the mean time until the production of the first single-mutant clone destined to mutate,  (c.f. Eq. (5)). N = 103 stem cells and mutation rates are u0 = 10−6 and u1 = 10−3 (cross in panel B). (D) Corresponding cumulative risk from simulation (symbols) and Eqs. (S55) and (S56) (lines).

