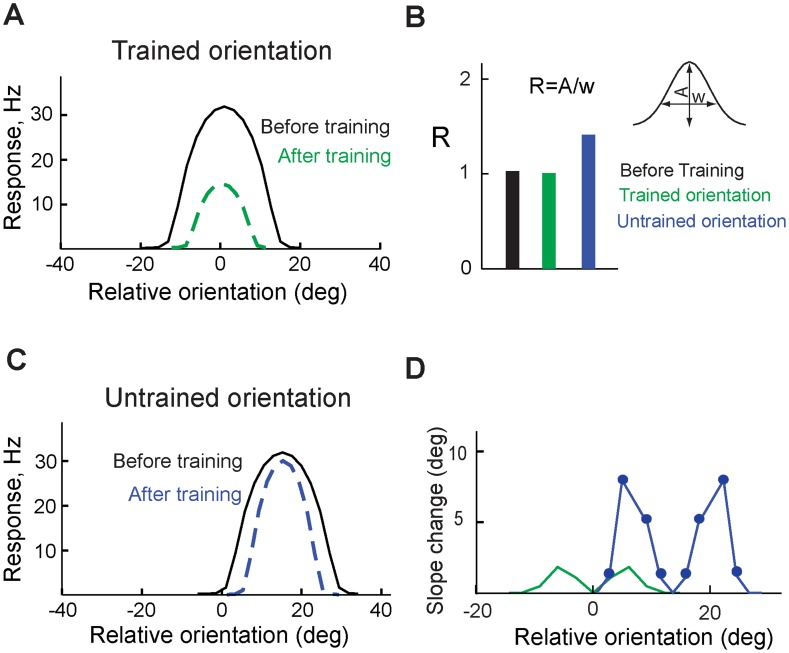
Figure 4. Enhancement of stimulus selectivity.
A. Tuning curve of a V1 neuron that preferred the trained orientation; before (black) and after (green) training. B. Amplitude-to-width ratio (R) of the tuning curve before (black) and after training (green) in a neuron that preferred the trained orientation, and in a neuron that preferred different orientation (blue). C. Tuning curve of a V1 neuron that preferred orientation different than the trained one; before (black) and after (blue) training. D. Slope change of the tuning curve of the V1 neuron the preferred the trained orientation (green) and another V1 neuron that preferred another orientation (blue line with filled circles).

