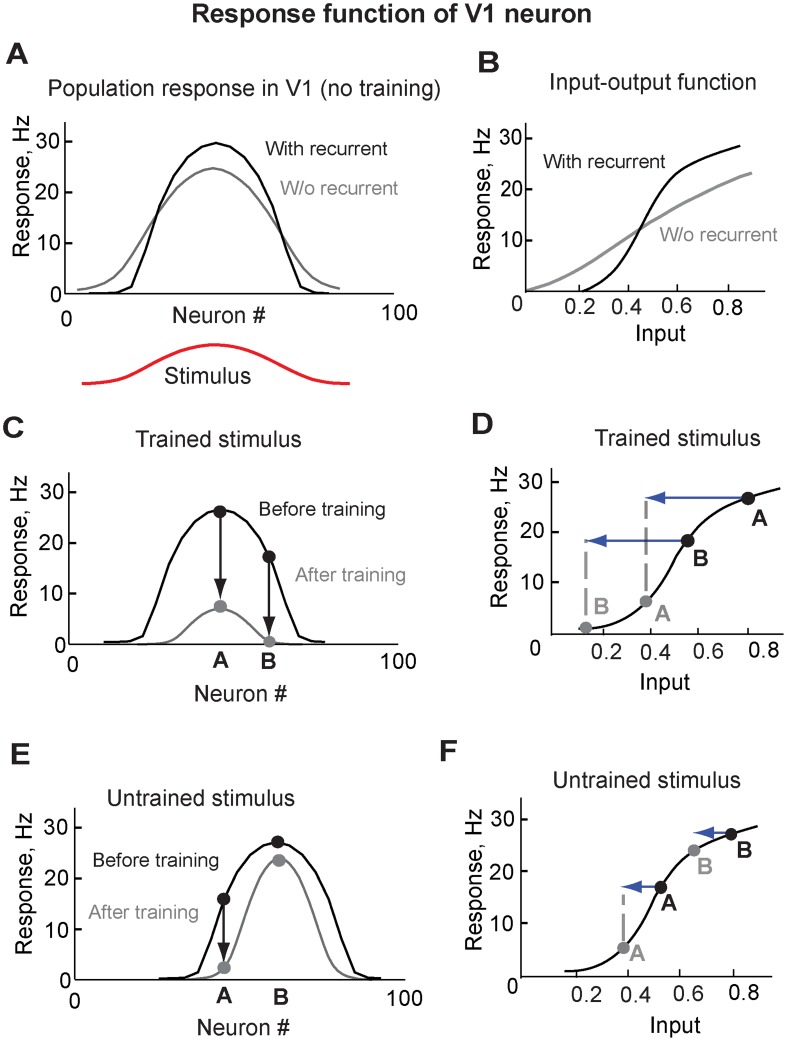
Figure 6. Effect of feedbacks on population response in V1.
A. Population response in V1 to a stimulus before training, with (black) and without (grey) recurrent connections among V1 neurons. B. Input-output function in V1 neurons, with (black) and without (grey) recurrent connections among V1 neurons. C. Population response in V1 to the trained stimulus (preferred stimulus for neuron A) before and after training. D. Responses of neurons A and B to the trained stimulus (preferred for neuron A) changed due to feedback. Black line indicates input-output relation in V1. Blue arrows indicate the strength of feedback inputs. Black and grey filled circles represent neural response of neurons A and B to the trained stimulus before and after training. E. Population response in V1 to a novel stimulus (preferred for neuron B), before and after training with the stimulus preferred for neuron A. F. Responses of neurons A and B to the novel stimulus (preferred for neuron B) changed due to feedback. Black line indicates input-output relation in V1. Blue arrows indicate feedback inputs. Black and grey filled circles represent neural responses to stimulus preferred for neuron B before and after training.

