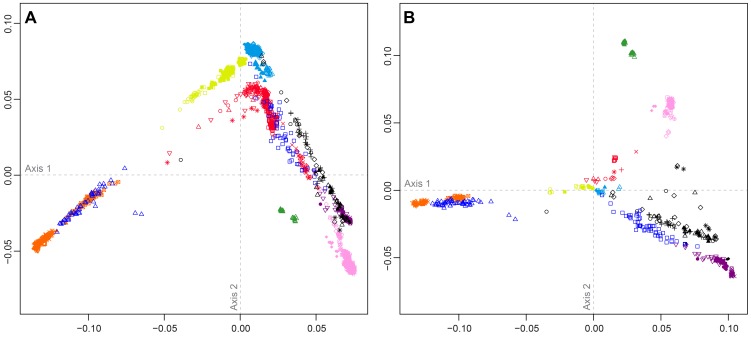
Figure 4. Individual-level population structure.
(A) Multidimensional scaling plot of pairwise allele-sharing distance (ASD) among 2,140 individuals in the combined dataset. (B) Multidimensional scaling plot of pairwise ASD among 528 individuals from 63 worldwide populations, following the resampling of a maximum of 82 individuals each from 11 different population groups. Group choices for resampling were taken from Figure S6. Population colors and symbols follow Figure 1.

