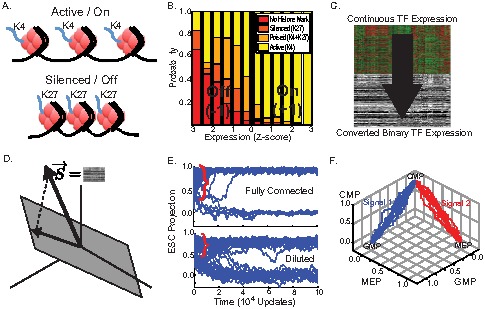
Figure 2. Overview of model.

(A) Histone 3 tri-methylation at lysine 4 (K4) is associated with active genes, while histone 3 tri-methylation at lysine 27 (K27) is associated with repressed genes. (B) Conditional probability distribution of histone modification (HM) given transcription factor (TF) expression levels derived by comparing microarray data with HM data from [36], [37]. Notice the sharp threshold (black line) between expression levels of active and inactive TFs. (C) For mathematical convenience, we take the continuous TF expression levels and convert it to binary states (z-score  to
to  and z-score
  to
to  ). This binarization is consistent with the result from (B). (D) An arbitrary state is represented by a vector
  of
of  , with each dimension in the vector space representing the state of a TF. The natural cell fates form a subspace (gray plane). The landscape model is based on the orthogonal projection of the TF state onto this subspace. (E) The dynamics of the landscape model for different initial conditions for a fully connected interaction matrix
  and a diluted (non-equilibrium) interaction matrix where 20% of interactions have been randomly deleted. Plot shows the projection of
  on embryonic stem cells (ESC) as function of time. Notice the large basins of attraction (red bracket). Parameters used were
  and burst errors of
  every
every  spin updates. (F) Simulations showing how a common myeloid progenitor (CMP) can differentiate into either granulo-monocytic progenitors (GMP) or megakaryocyte-erythroid progenitors (MEP) in response to two distinct external signals. All trajectories used
  . For signal 1, we set
  and all other
  . For signal 2, we set
  and all other
  .
.
