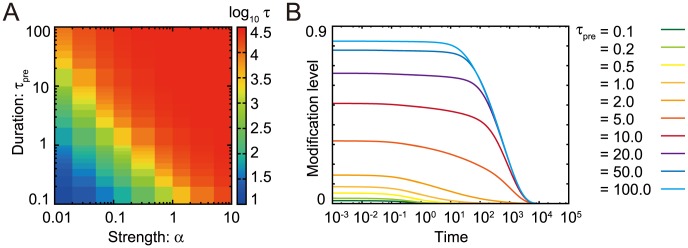
Figure 5. Dependence of the relaxation process  on the magnitude and duration of a stimulus.

(A) The relaxation time after exposure to the stimulus with various magnitudes and durations is plotted as a color map. The initial condition is given as  and
and  for
for  , and the input is given as
  for
for  and
and  for
for  . When the magnitude (
 ) and duration of the stimulus (
 ) increase,
  increases continuously over an order of magnitude. The catalyst concentration is set at
  of the substrate concentration. (B) Dependence of the relaxation process on the duration of stimulus exposure. The duration of stimulus exposure is changed while the magnitude is fixed at
  . Here, the relaxation time increases nearly exponentially with the increase in duration for the some extent small
  . When
  is sufficiently long, the modification is maintained for a long time.
