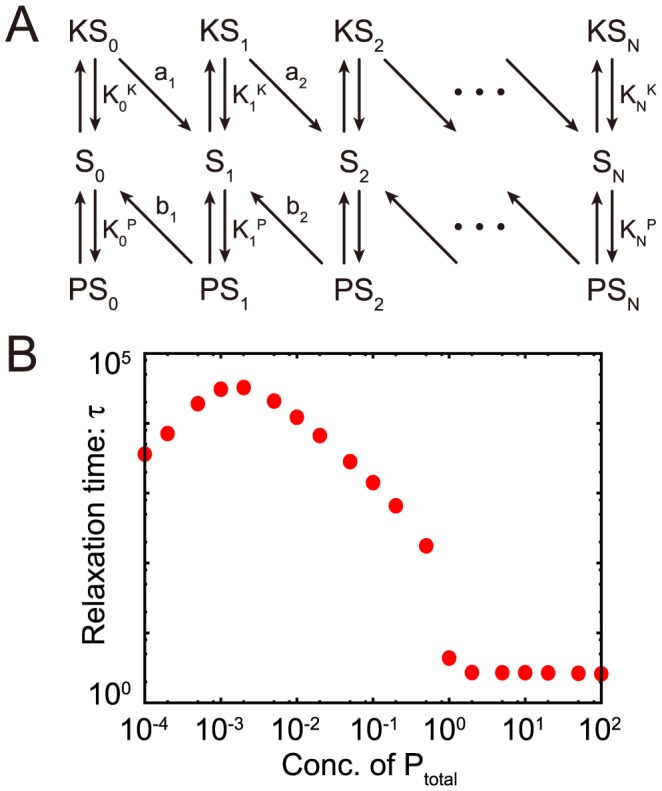
Figure 6. Kinase-phosphatase model (A) and its relaxation time (B).

The relaxation times  of the variables
  are plotted against the total concentration of phosphatase.
  is defined as the time when the summation of
  of all
  falls below the threshold value, after relaxation at a kinase-rich condition (
 ). The model shows the transition from fast exponential relaxation to slow logarithmic relaxation at the critical point (
 ). (When the amount of the phosphatase is lower than that of kinase (
 ), the relaxation time itself is shorter, whereas the logarithmic relaxation remains. Here, the stable fixed-point value of the concentration
  changes to a higher value, and the relaxation time is decreased.)
