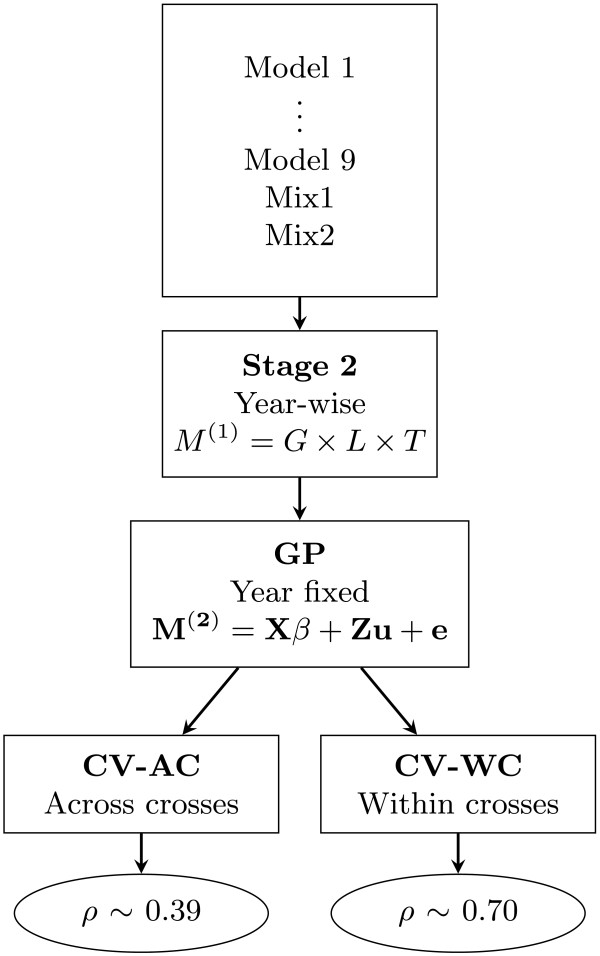
Figure 2.

General representation of model comparison through all the stages of the analysis. Datasets generated from 9 spatial and non-spatial models plus two mixed datasets generated from best models given the Akaike information criterion (Mix1) and the predictive abilities (Mix2). Factors in second stage were genotype (G), location (L) and tester (T). M
(1) represents the adjusted mean of genotypes across locations and years. M
(1)=G×L×T is the shorthand notation for  . In the genomic prediction (GP) stage M
(2) is the adjusted mean of genotypes across locations, X and β are respectively the design matrix and parameter vector of fixed effects, Z is the n×p marker matrix, u is the p-dimensional vector of SNP effects and e the error vector. Sampling methods in cross validation (CV) were across crosses (AC) and within crosses (WC). The final predictive abilities (ρ) are presented in the ellipses.
