Figure 4.

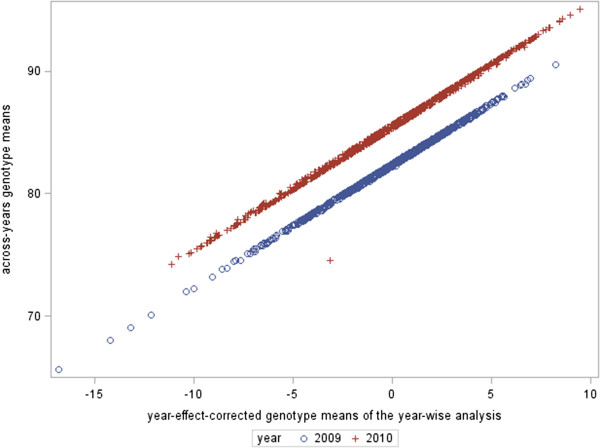
Comparison of approaches for year adjustment. In the x-axis, the genotype adjusted means across-year analysis are plotted. In the y-axis, the year-effect-corrected adjusted means from the year-wise analysis are depicted.

Comparison of approaches for year adjustment. In the x-axis, the genotype adjusted means across-year analysis are plotted. In the y-axis, the year-effect-corrected adjusted means from the year-wise analysis are depicted.