
Figure 6.
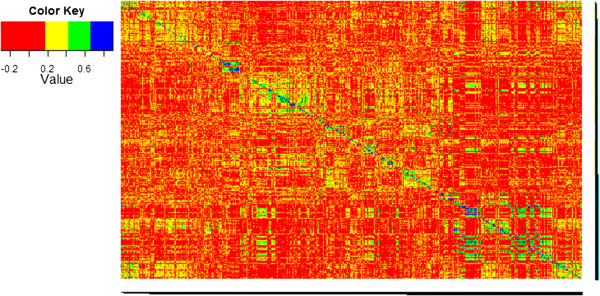
Marker-based relationship heat-map. Visualised are pairwise relationship coefficients estimated from the maker data for genotypes of years 2009 and 2010. Higher values represent a stronger relationship.
Official websites use .gov
A
.gov website belongs to an official
government organization in the United States.
Secure .gov websites use HTTPS
A lock (
) or https:// means you've safely
connected to the .gov website. Share sensitive
information only on official, secure websites.
Marker-based relationship heat-map. Visualised are pairwise relationship coefficients estimated from the maker data for genotypes of years 2009 and 2010. Higher values represent a stronger relationship.