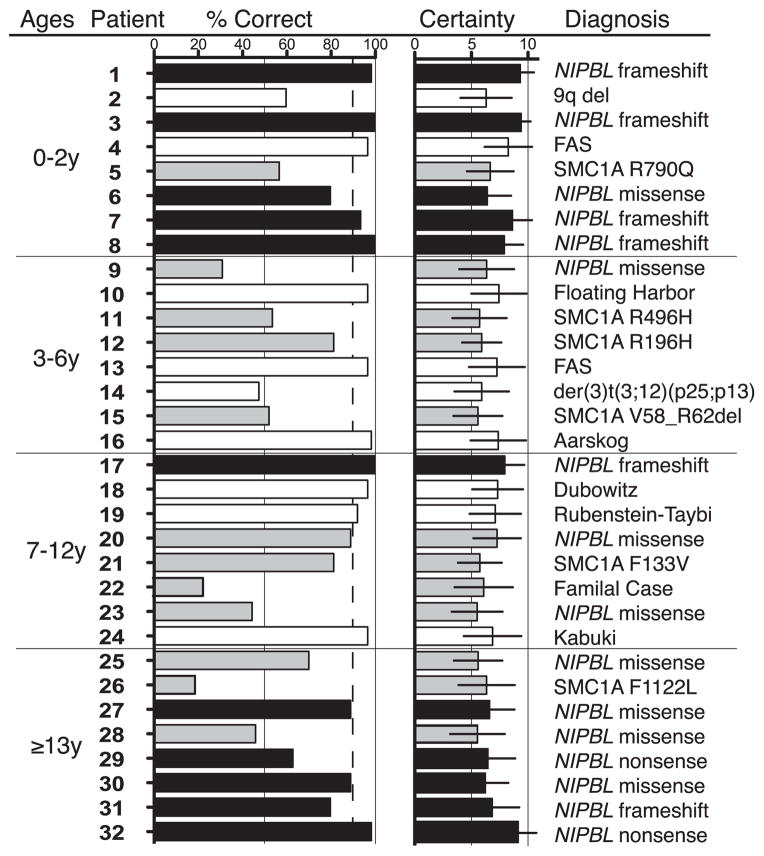
FIG. 3.
Distribution and accuracy of CdLS diagnoses. Patient numbers correlate with Figure 1. Percent correct for each patient is indicated by a horizontal bar graph, with the scale from 0% to 100% indicated above. The dashed line indicates the 10% incorrect threshold, below which, individuals were analyzed by further analysis. The average certainty of diagnosis for each patient is indicated as a horizontal bar graph, with below the scale of 0 (least certain) to 10 (most certain). Horizontal black bars at the right side of the column indicate the standard deviation for the diagnosis certainty of each patient. Diagnosis of each patient and/ or CdLS molecular confirmation is indicated at the right. Solid black columns indicate patients with “classical” CdLS, solid gray bars indicate those with “mild CdLS” and open columns indicate patients with other diagnoses. Fine horizontal lines divide the age groups as indicated in the text.

