Abstract
For the 10th experiment on Critical Assessment of the techniques of protein Structure Prediction (CASP) the prediction target proteins were broken into independent evaluation units (EUs), which were then classified into template-based modeling (TBM) or free modeling (FM) categories. We describe here how the EUs were defined and classified, what issues arose in the process, and how we resolved them. Evaluation units are frequently not the whole target proteins but the constituting structural domains. However, the assessors from CASP7 on combined more than one domain into one evaluation unit for some targets, which implied that the assessment also included evaluation of the prediction of the relative position and orientation of these domains. In CASP10, we followed and expanded this notion by defining multi-domain evaluation units for a number of targets. These included three EUs, each made of two domains of familiar fold but arranged in a novel manner and for which the focus of evaluation was the inter-domain arrangement. An EU was classified to the TBM category if a template could be found by sequence similarity searches and to FM if a structural template could not be found by structural similarity searches. The EUs that did not fall cleanly in either of these cases were classified case-by-case, often including consideration of the overall quality and characteristics of the predictions.
Keywords: CASP, CASP10, protein structure, structure prediction, domain definition, evaluation unit, assessment unit, classification
INTRODUCTION
CASP (Critical Assessment of Techniques for Protein Structure Prediction) is a community-wide experiment to objectively assess the state of the art in tertiary structure prediction of protein molecules from their sequences alone. The biennial exercise is conducted in a double blind manner in which protein structures are predicted before their 3D structures are known and the predictions are assessed by independent assessors without knowing the identity of the predicting groups. CASP ROLL is a sister experiment in which the target sequences are released, and the predictions collected, year-round. The collected predictions are then evaluated at the time of the regular CASP experiment. The purpose of the ROLL experiment is more rigorous evaluation of template free prediction methods through assessment of a larger number of targets.
The 10th regular CASP experiment (CASP10) was conducted in 2012, for which the CASP Prediction Center collected and released 114 sequences (T0644 to T0758 except T0748; see http://www.predictioncenter.org/casp10/targetlist.cgi/), of which 18 were cancelled (Table I): Seven (T0647, T0656, T0660, T0670, T0718, T0728, T0730) because the structure did not become available in time for evaluation; nine (T0646, T0665, T0722, T0723, T0727, T0729, T0745, T0751, T0754) because the structural information was exposed prematurely; one (T0725) because of sequence error; and one (T0700) because the determined structure had too few residues. Thus, the final CASP10 targets comprised the remaining 96 sequences.
Table I.
Number of targets
| Total number of structures | 114 | |
| Cancelled | 18 | |
| No structure | 7 | |
| Information leaked | 9 | |
| Sequence error | 1 | |
| Poor structure | 1 | |
| Number after cancellations | 96 | |
| Number of evaluation units | 131 | |
| TBM | 111 | |
| FM | 19 | |
| TBM/FM | 1 |
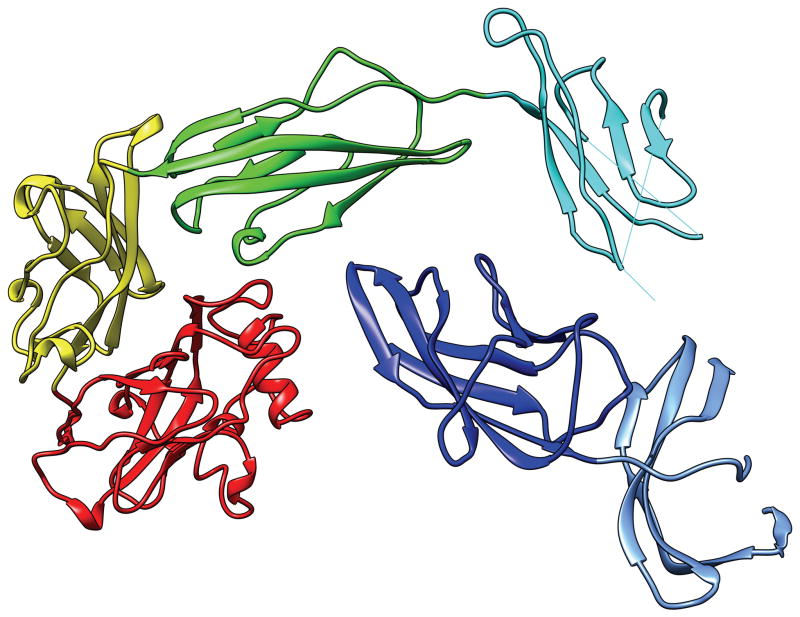
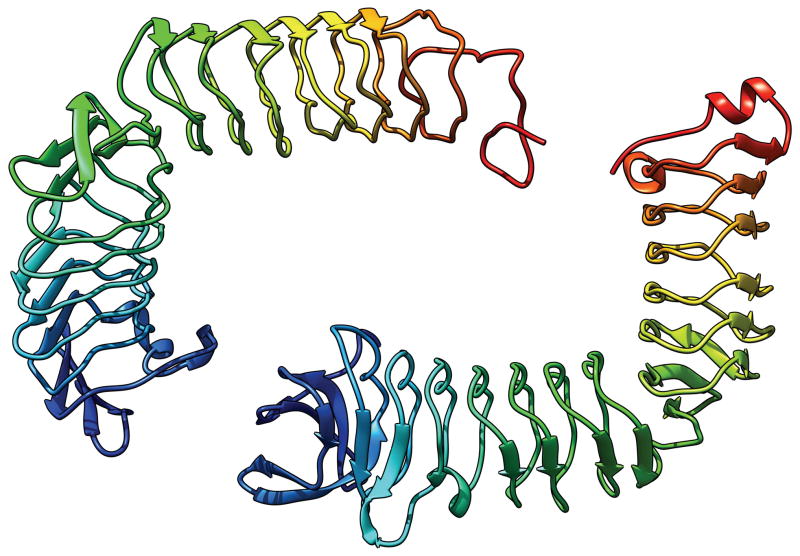
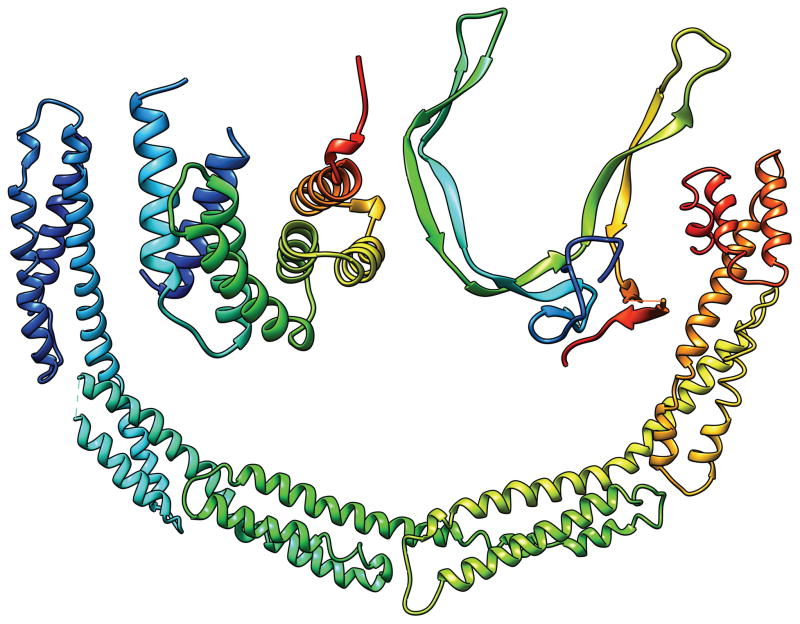
In most cases, an evaluation unit is the whole target protein. However, when the target protein contains more than one domain, individual domains, not the multi-domain whole protein, should be the evaluation units (EUs) in many cases. For example, Fig. 1 shows a 6-domain protein T0719. The linkers between domains in this protein appear to be flexible and the relative position and orientation between domains are likely to vary depending on the environment. It is therefore unreasonable to expect predictors to produce models that reproduce the inter-domain relations that are observed in this particular crystal form. In this report we describe the process used to prepare and classify the evaluation units against which the submitted CASP10 models were evaluated. The CASP ROLL targets were handled separately by the FM-category assessment group1. The procedure they used for defining the evaluation units is similar to the one described here; the details of CASP ROLL targets are discussed in a separate paper1.
Fig. 1.
T0719: an example of the case where each domain is an evaluation unit. The colors indicate different domains. The N-terminus is in the dark blue domain, the C-terminus in the red domain.
It is well known2,3 that there is no universally accepted method for defining domain boundaries in all cases. We defined domains manually for each individual target protein, taking into consideration the usual criteria for domain definitions, including geometrical intra-domain integrity and inter-domain separation, difference in the architectures of the sub-structures, the existence of template structures, and the outputs of automatic domain parsing programs (DDomain4, DomainParser5, DomainParser26, and PDP7). Side chain orientations and interactions were considered to determine the precise domain boundaries. In a majority of cases, domains could be defined unambiguously by these procedures and no discussion was needed. Inevitably, however, we encountered cases where subjective judgment had to be used to define domains and domain boundaries. The process can be non-trivial and we describe here the issues that arose and the choices we made to resolve them.
Inter-domain relations in multi-domain proteins are not always as flexible as they appear to be in T0719 shown in Fig. 1. In some multi-domain proteins, two or more domains are arranged in a fixed manner. It has been the practice since CASP78–10 that such domains are considered as one evaluation unit (or “assessment unit”) if template structures can be found that contain the same set of domains arranged in the same manner, “to promote development of methods that find correct domain assembly”9, and we followed it here.
In addition, there were a number of cases, as will be described later in more detail, in which the relative position and orientation of domains, or more generally sub-structures, were novel and an important aspect of the target structure. In such cases also, we defined the set of sub-structures and their relative orientations as one EU even though there are no spanning template structures.
We also recognized that a target structure can contain regions that are flexible or of poor structural quality, which make them unsuitable to be used as the standard against which to measure the prediction accuracy. We identified such regions and removed them from the evaluation unit using a newly developed protocol.
An evaluation unit was classified into a TBM (template based modeling) or an FM (free modeling) target. The classification is important because models were evaluated by different assessment teams using different evaluation methods depending on the target class (Montelione’s team for the TBM target models evaluated using the GDT and other numerical scores; Lee’s team for the FM target models evaluated by visual inspection). Generally, an EU was called a TBM target if we judged that a template structure could be found by sequence similarity searches and an FM target if no template structure could be found even by structural similarity searches after the target structure was known. Obviously, there were EUs for which potential templates had only poor structural similarity with the target and/or were difficult to find because they had poor sequence similarity. We will discuss some of these borderline cases and describe the factors that went into consideration.
MATERIALS AND METHODS
VALIDATION OF EXPERIMENTAL TARGET STRUCTURES
We used knowledge-based structural quality assessment metrics to identify regions that are flexible, imprecisely defined, or of poor structural quality. Every experimental target was visually inspected and manually assessed using both the full Molprobity11 and KiNG12 interactive protein structure analysis software, and largely numerical Protein Structure Validation Software Suite (PSVS)13,14. Surface loops with high B factors or sparse density, those that adopt different conformations in different molecules in the asymmetric unit, and polypeptide segments with poor Molprobity scores adjacent to such poorly defined surface loops were excluded from the atomic coordinates used for model assessment. For structures with extensive problems identified by Molprobity, the experimental structure validation information was conveyed back to the experimentalists who had provided their structure. In some cases, the resulting re-inspection of the structure against the original data by the experimentalist resulted in a refined experimental target structure, which was then used in the assessment process. In one case, the incompletely refined experimental structure identified by these methods was withdrawn.
For NMR structures, the ensemble representations provided by experimentalist provide information on the degree of convergence of the structure determination process in different regions of the model. Imprecise definition of atomic coordinate positions in NMR structures may be the result of internal dynamics and/or incomplete experimental data15. This information is important for determining which parts of the target structure can be used reliably for assessing the accuracy of predicted models. This issue has been addressed in previous CASP assessments9. Not-well-defined residue segments (e.g. flexible surface loops) can be identified from the ensemble of models comprising the NMR structure using an interatomic variance matrix approach16 as well as using co-centering procedures in KiNG12,17 For the CASP10 prediction assessment, atomic coordinates for not-well-defined regions were identified using the Expanded FindCore algorithm, developed specifically for this CASP10 assessment project. These “non-core” atoms were then excluded from the evaluation units using the criteria and detailed protocol described in the accompanying paper18. In a handful of cases, the Expanded FindCore algorithm was also used to identify statically disordered regions of X-ray crystal structures by comparing the multiple structures present within asymmetric units. These inconsistent regions of the X-ray crystal structures were also excluded from the coordinates of the EU’s.
TEMPLATE STRUCTURE SEARCHES
It is important to find structures in the known protein structure database that are similar to the target structure, both for the definition of the evaluation units and to properly classify them. Such structures are called templates in this paper because some of these are used as templates for building predicted model structures. The template structures were found by the Prediction Center at UC Davis. The Lee group at NIH also found them independently, which complemented those found by the Prediction Center.
The Prediction Center ran an initial template search for whole targets soon after the experimental structure became available, which was usually a few weeks after the prediction deadline. Additional searches for separate domains and their combinations (putative EUs) were made as needed during the EU definition process. The procedure used for these searches was the following.
Split all PDB19 files (roughly ~80,000 proteins at the time of the CASP10 searches) into separate X-ray chains and NMR-models. This resulted in ~400,000 structures.
Cluster these ~400,000 structures at 97% sequence identity using CD-HIT20. This resulted in ~36,000 clusters.
Select one representative from each cluster (as suggested by CD-HIT).
Run MAMMOTH21 for fast structure comparison of the target domain with the ~36,000 representative structures and retain 2,000 top MAMMOTH hits.
Complement the 2,000 with all the structures from their clusters. This resulted in approximately 22,000 structures per domain on average.
Run LGA22 structure comparison of the target domain vs the extended list (22,000 structures per domain on average).
Select best templates for each domain according to the LGA_S score.
The procedure used by Lee’s group at NIH was less involved and used mainly to complement the Prediction Center results and in finding the “non-spanning” templates (see below). It consisted of running the TM-align23 against a non-redundant database of PDB chains, called PDB-NR, which is made of 26,995 chains determined by either X-ray or NMR with no two members having higher than 95% sequence identity. This database was compiled in July 2012 using PISCES24.
AN EXAMPLE OF EU DEFINITIONS (T0726)
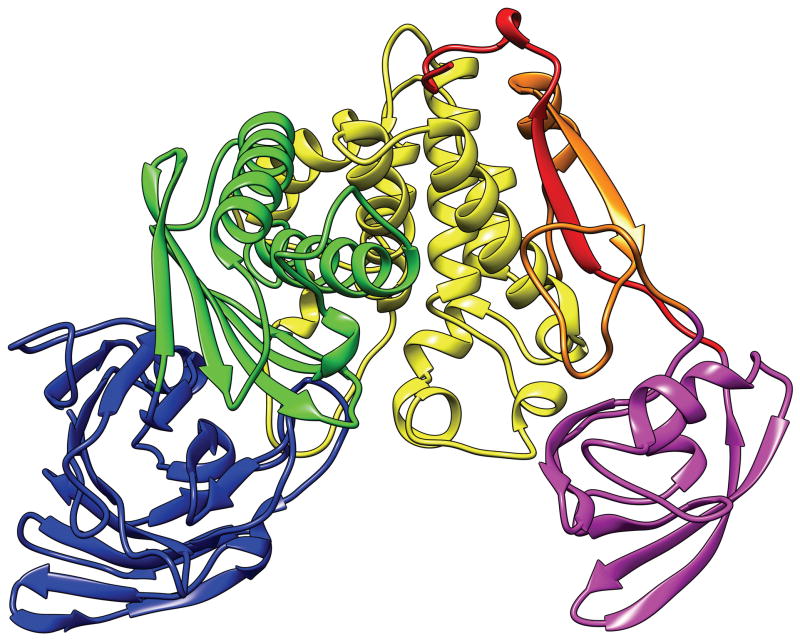
We describe the process of defining EUs for the target T0726 as an example. The structure of T0726 is shown in Fig. 2. From the geometry and architectural features of local sub-structures, one can recognize 5 structural units in this structure: d1 (blue, residues 1–172), d2 (green, 173–284), d3 (yellow, 285–447), d4 (orange, 448–483, and red, 565–587), and d5 (magenta, 484–564). The segmented unit d4 consists mainly of a 2-stranded β-ribbon and serves as the linker between d3 and d5. It probably will not maintain its structure in isolation and is an example of what we call ‘decoration’ (see below). We initially parsed this structure into 4 domains (d1, d2, d3–d4, and d5) by including d4 as a part of d3 since d4 seemed to interact most extensively with d3. However, we later found templates that spanned d1, d2 and d3 and a separate template for d5. Therefore, we defined 3 EUs for this target, D1: 1–447 (d1, d2, and d3 combined, blue, green and yellow in Fig. 2); D2: 484–564 (d5, magenta); and D3: 448–483 and 565–587 (d4, orange and red). We realize that D3 is probably not an independently folding unit. On the other hand, D1 and D2 are both TBM targets since sequence-homologous templates exist. Inclusion of D3 as a part of either D1 or D2 would complicate the evaluation of template-based modeling. D3 is a difficult structure to predict (90th percentile GDT-TS score is 27.5) since it is segmented and no proper template can be found. By having D3 as a separate FM target, it can be evaluated by visual inspection.
Fig. 2.
T0726: an example for illustrating the domain parsing process. Colors indicate different structural units. See the main text. The N-terminus is in the blue unit, the C-terminus in the red unit.
NON-TRIVIAL EU DEFINITIONS
In most cases, domain definitions were straightforward and each domain was assigned an EU. The targets for which EU definition was non-trivial could be grouped into the following six categories.
(A) Multi-domain structures with spanning templates
These are multi-domain proteins for which sequence-homologous template structures can be found that span two or more target domains, which then become a candidate for one EU designation. However, even if templates can be found that span both domains in a two-domain target, there could be other structures with the same two domains in different relative orientations (“non-spanning” templates). We checked this possibility by the following procedure.
Call the domains in a two-domain target D1 and D2. Run the structure comparison program TMalign23 using D1 on PDB_NR (see above) and collect hits with TMscore better than 0.70. Call this set L1. Repeat the procedure using D2 and the same database and call the second set of hits L2. Collect the chains that are in both L1 and L2 (intersection of L1 and L2) and call them set L. The chains in L are of three different types: (1) Chains that contain both the D1-like and D2-like domains, arranged in the same manner as in the target structure. These are called the spanning templates. (2) Chains that contain both the D1-like and D2-like domains, but arranged in the manner different from that in the target structure. (3) Chains that contain only one domain, which is similar to both D1 and D2. This happens when D1 and D2 are similar.
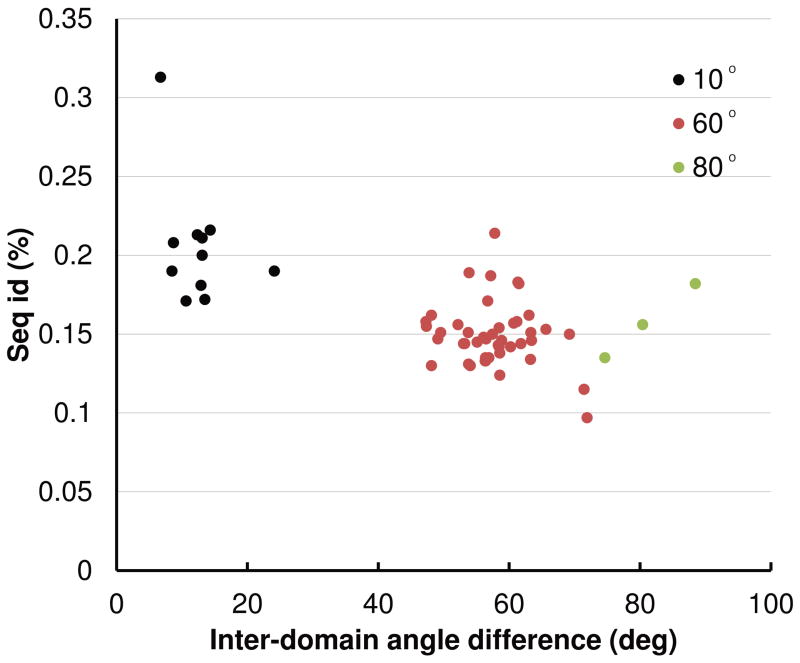
We excluded the third type of chains manually by visual inspection. In order to distinguish between the first two types, we superimposed the target to the template using only D1 to obtain a transformed copy of the target, T1, and superimposed again using only D2 to obtain another copy, T2. Superimposing T1 to T2 gives a rotation matrix from which the rotation angle can be calculated. This angle will be zero if the two domains are arranged the same way in both the target and template and in general serve as a single scale measure of the difference in inter-domain relations in the target and the template. If this angle (referred to in Fig. 3 as the inter-domain angle difference) was bigger than ~30°, we concluded that D1 and D2 had different orientations in the template. The cutoff value of 30° was chosen because the distribution of this angle was bi-modal and very few templates had this angle between 20° and 45° (data not shown).
Fig. 3.
Sequence identity versus the inter-domain angle difference of spanning templates of T0721. The three groups of templates with the inter-domain angle differences centered around 10°, 60°, and 80° are colored black, red, and green.
According to this test, all but one target with a spanning template could be considered as one EU because their list L did not contain type 2 chains. These include the two-domain targets T0644, T0681, T0683, T0692, T0694, T0696, T0697, T0704, T0715, T0733, T0744, T0746, T0755 (circularly permuted with respect to the templates), and T0757 and the first three domains of T0726. We also consulted the ‘Grishin plots’, which are the plots of the weighted sum of GDT scores for individual domains versus the GDT score for the whole protein9, and the position-specific alignment plots25 (see the Prediction Center web site). For each of these proteins, the Grishin plot suggested no or weak split and the position-specific alignment plot indicated that predictions with high GDT-TS scores had both (or three in the case of T0726) domains arranged as in the target structure.
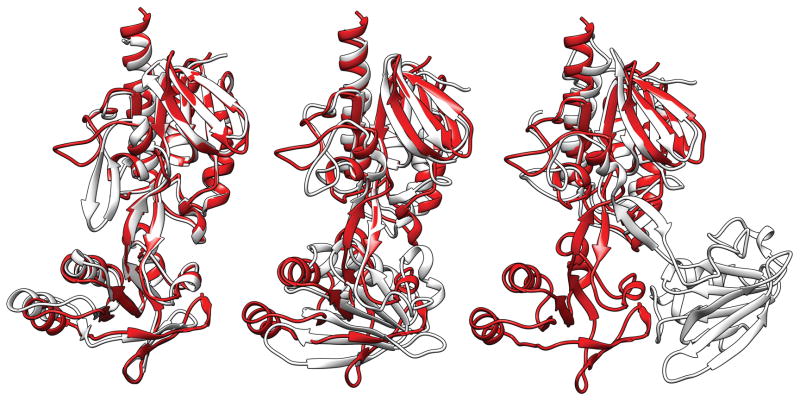
The single potential exception was T0721. There were 58 templates in L for this target in PDB_NR. Fig. 3 gives the percent of identical residues after optimal superposition versus the inter-domain angle difference. This graph and the visual inspection of the templates show that there are three groups of templates: One group of templates have the inter-domain angle difference centered around 10° (black dots in Fig. 3), the second group around 60° (red dots), and the third around 80° (green dots). The first group of templates have higher percentage of identical residues and their two domains are arranged essentially the same as in the target. An example is 3fsb (Fig. 4A). In other templates, the two domains are arranged differently from those in the target as exemplified by 3cty (Fig. 4B) and 2zbw (Fig. 4C) for the second and third groups, respectively. Even though there are these three types of templates, we noted that the templates with the small inter-domain angle difference tended to have higher sequence similarity than other templates (Fig. 3). Both the ‘Grishin plot’ and the position-specific alignment plot suggested no split. We therefore assigned one EU for the whole of this target as well.
Fig. 4.
T0721 (red) superimposed to the spanning templates (white) 3fbs (left), 3cty (middle), and 2zbw (right).
(B) Proteins with two domains that have a special inter-domain arrangement
Some target proteins contain domains or sub-structures of known folds but arranged in an unusual manner. The average GDT_TS score of the predictions for such targets is high for each of the individual domains but low for the entire structure. The ‘Grishin plot’ shows a significant deviation from the diagonal. For these targets, prediction of the structure of individual domains is relatively easy, but the challenging aspect of the structure is the relative position and orientation between the sub-structures. Therefore, we decided to define the whole structure as one single EU of the FM category (with designation D0), solely to assess the quality of the inter-domain arrangement. In most cases (with one exception, T0734), individual domains were also kept as separate EUs in the TBM category. Following are the proteins of this type.
T0663 (Fig. 5)
Fig. 5.
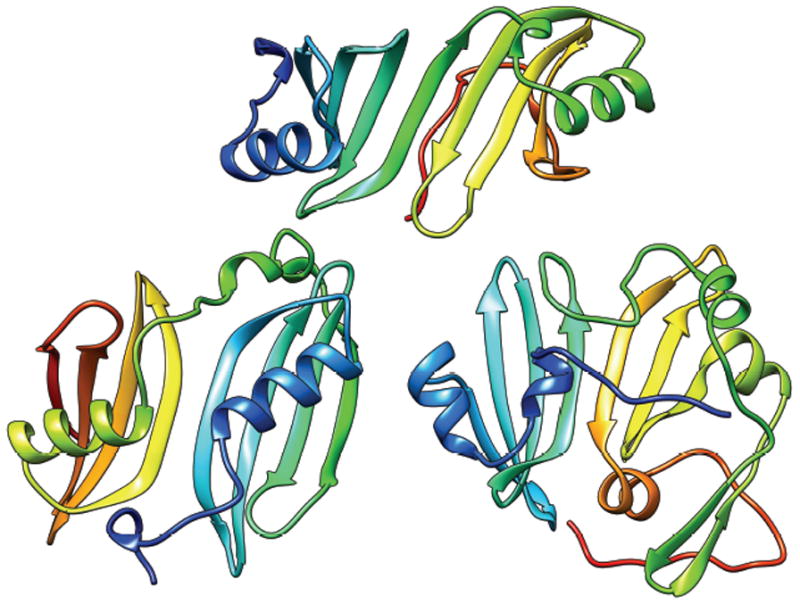
T0644 (top), T0663 (bottom, left) and T0717-D2 (bottom, right): all two-domain proteins with a common domain architecture. The structures are rainbow-colored from N- to C- termini. The whole protein is one EU of FM D0 designation for T0663, and TBM for T0644 and T0717-D2.
The three structures shown in Fig. 5 are similar in that they are made of two sub-structures, each of which is based on a common structural motif of one helix on a β-sheet of four antiparallel strands, except for the second domain of T0717-D2, which has three strands in the main sheet. (One of the domains in T0684 also has this motif.) In each of the structures, the two β-sheets from the two sub-structures line up to form one continuous sheet of 8 (7 for T0717-D2) antiparallel strands, but the relation between the two sub-structures is different in the three structures. The repeats in T0644 are related by a translation, or a rotation around an axis nearly parallel to the strands, and requires a relatively short linker. The relations in T0663 and T0717-D2 are both a 2-fold rotation perpendicular to the β-sheet, with the rotation axis between the first (T0663) or the last (T0717-D2) strands of the two motifs.
We could find many templates that cover the whole of T0644, which was therefore considered as one EU in the TBM category (see above). On the other hand, the arrangement in T0663, which requires a long linker between the motifs, appears to be novel; we found no templates that had this arrangement. The position-specific alignment plot25 shows that predictors had one or the other sub-structure modeled well but no one did well for both. We, therefore, considered each sub-structure of this target an EU in the TBM category and the whole protein an additional EU with a D0 designation. T0717-D2 was treated more conventionally, as one EU in the TBM category, because (1) the interaction between the two sub-structures appears to be more extensive than in T0663 and (2) a few predictors did reasonably well for the whole domain, according to the position-specific alignment plot, suggesting that templates with structural similarity for the whole domain may exist.
T0690 and T0713 (Fig. 6)
Fig. 6.
T0690 (bottom right) and T0713 (left top): both kinked LRRs. The structures are rainbow-colored from N- to C- termini. For both structures, the whole sequence is defined as D0 EU’s.
These are kinked or ‘broken’ leucine-rich-repeat (LRR) structures26. The front and back sub-structures define D1 and D2, both regular LRRs and TBM targets. The relation between D1 and D2 appears to be novel. We defined D0 solely to assess this relation.
T0734 (Fig. 7)
Fig. 7.
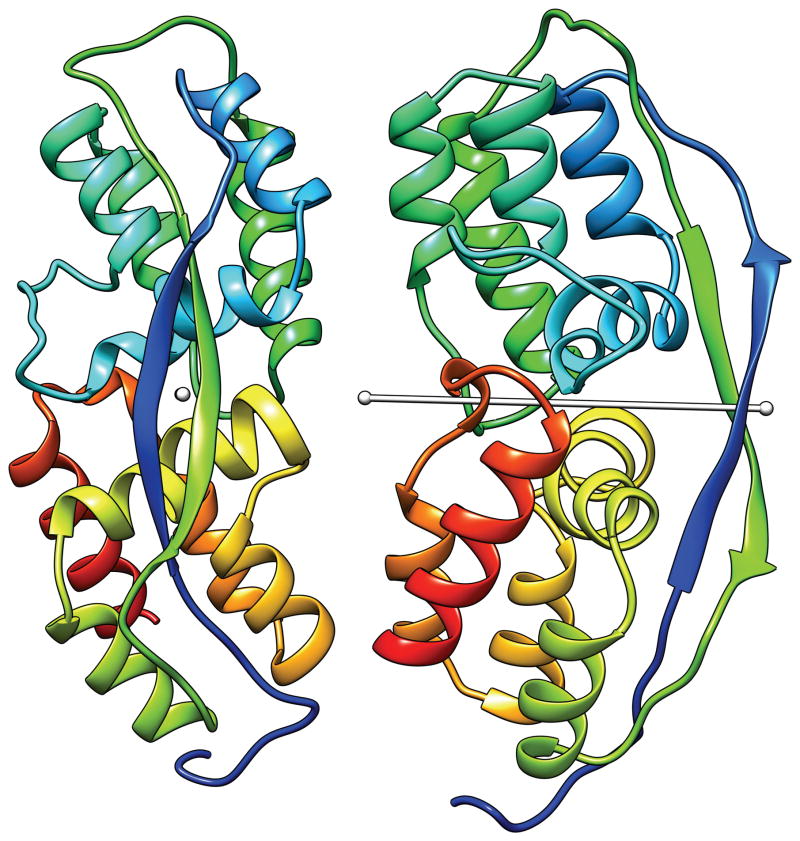
T0734: Tightly interacting two tandem repeats with 2-fold symmetry. The symmetry axis is the white rod with two small balls at either end. The viewing directions are down the symmetry axis (left) and perpendicular to it (right). The structure is rainbow-colored from N- to C- termini. The whole structure is one FM EU.
Tandem repeats arranged in 2-fold symmetric manner. Each repeat is made mainly of a short helix bundle. Two strands, one from each repeat, form a twisted two-stranded β-ribbon, which spans both repeats. The arrangement of the two repeats is the most interesting feature of the structure. They interact intimately both directly between their helical bundles and through the β-ribbon, which interacts with both helical bundles. This is an exceptional case in that (1) a convincing template could not be found for each individual repeat and (2) the two repeats interact intimately. We defined one EU for the whole protein in this case and decided against defining two additional EUs for the individual repeats.
(C) Structures with substantial ‘decorations’ (Fig. 8)
Fig. 8.
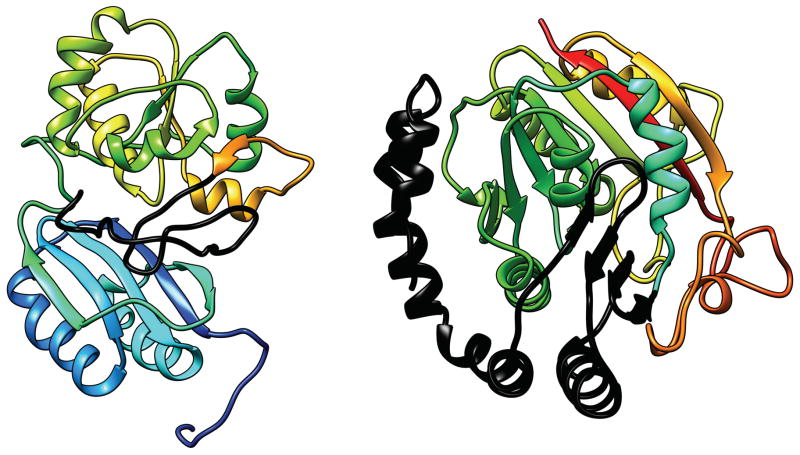
T0651 (left) and T0693 (right). The structures are rainbow-colored from N- to C- termini, except the decorations, which are colored black. Decorations are treated as D0 (T0651) and D1 (T0693).
Many targets are composed of one or more core domain, for which there usually are structural templates, plus other parts that have structures that do not appear to be independently stable. We call these additional structures ‘decorations’. In most cases, they consist of a small number of residues and we included them as a part of the core domain(s). However, there are exceptional cases like, for example, T0726-D3 mentioned earlier. We describe three other examples below.
T0691
This is essentially a one-domain protein, for which a template structure can be found, except for the small number of residues at both the N- and C-termini, which do not exist in the template structure. The N-terminal residues were removed from the domain definition because most of them are not seen in the crystal structure and those that are present have different conformations in different chains in the crystal structure. On the other hand, the C-terminal 13-residue decoration, residues 151–163, protrudes outside of the structure and has an extended but well-defined conformation. In the crystal structure, this protein forms a 2-fold symmetric dimer in which the C-terminal residues of one monomer reach across to the other monomer so that the C-terminal arginine side chain is at the active site of the neighboring monomer. Even though this tail is not flexible in the crystal structure, it probably is flexible in the monomer state. We decided to remove this decoration.
T0693
This protein has a core domain D2 for which there are good templates, plus a 100-residue long N-terminal decoration, D1. D1 by itself has a rather extended structure that has an extensive contact with D2 by wrapping around it. It is unlikely that D1 will have this conformation without D2. On the other hand, it has some structure, including several helices and a 4-stranded β-sheet, and seems to be too large to be considered as a part of D2. We are hesitant to call D1 a separate domain, but decided to define it as an EU in the FM category, separate from D2, which is an EU in the TBM category.
T0651
This is a protein consisting of two domains, D1 and D2, for both of which template structures exist, plus the C-terminal 33-residue decoration, D3, for which there is no template. D3 has some structure, but the most important feature of D3 seems to be that it is placed between D1 and D2 and the C-terminal lysine residue is pointed inward so that its charged NH3 group is at the bottom of a deep pocket between D1 and D2. In this case, if D3 is defined as a separate EU, there is no way to evaluate what seems to be the most important aspect of D3, which is its placement with respect to D1 and D2. We decided not to define D3 as a separate EU but to define the whole protein as an EU with D0 designation, solely in order to evaluate the position and orientation of D3 with respect to the rest of the protein.
(D) Homo-dimers with a dimerization domain
These structures have a well-defined domain plus a separate and apparently incomplete domain, which becomes complete by forming a homo-dimer. We found four targets with such domain organization. For three of these (T0686, T0724, T0756), we defined the dimerization domain as a separate domain. For T0702, we defined one EU for the whole protein because there are templates (e.g. 2rcy) that cover the whole chain and which can be found by sequence searches. Template structures could be found for all the dimerization domains but that in T0756.
(E) Domain-swapped dimers (Fig. 9)
Fig. 9.
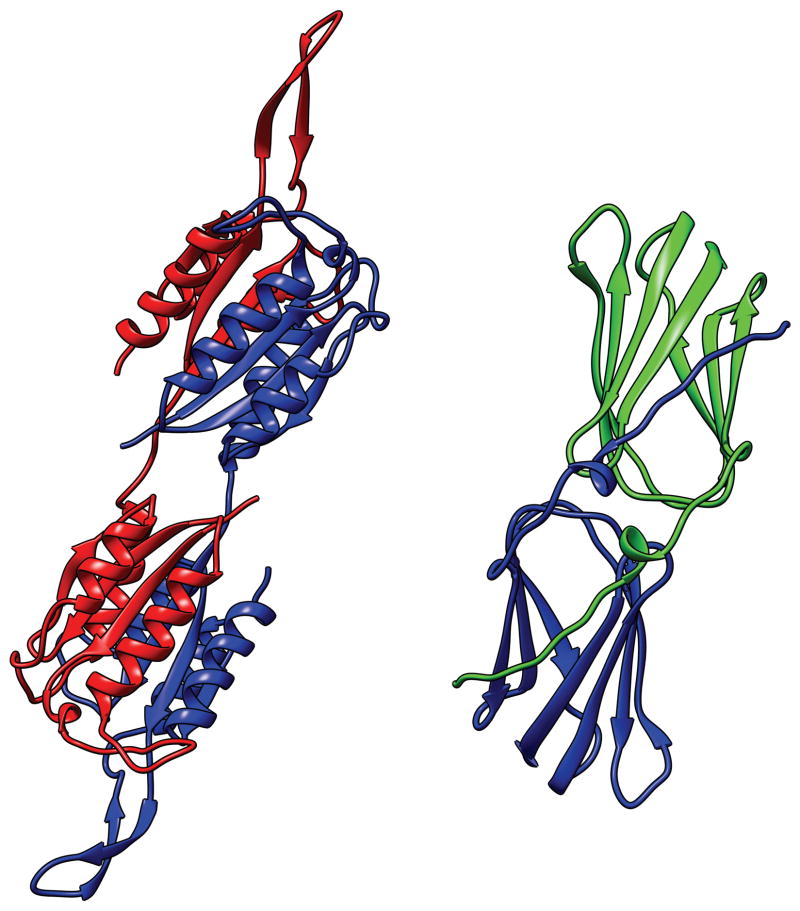
T0706 (left) and T0747 (right): domain-swapped dimers. Colors indicate different chains. The EU’s were defined by “unswapping”, as described in the text.
There are two targets (T0706 and T0747), each of which forms a symmetric dimer in which a part of one monomer (the swapped domain) is replaced structurally by the equivalent part from the other monomer. Domain swapping is not an uncommon feature of a protein structure27. An isolated monomer in such a dimer has a structure in which the swapped domain protrudes out from the rest of the structure like the dimerization domain in case (D) above. We considered the following three options for handling these targets: (1) Use the monomer structure as is. This would be a difficult structure to predict unless the predictor realizes that the structure forms a domain-swapped dimer and know the boundary of the swapped domain. (2) Define swapped part as a separate domain as we have done for the dimerization domain. (3) Create a new structure by unswapping, i.e. form a new structure by taking the unswapped part of one monomer and linking it with the swapped part of the other monomer. For both targets, we chose the third option because we could not find any template that had the domain-swapped form for either target and because the position-specific alignment plot also indicated that no prediction had the domain swapped form for either target. Thus, for T0706, the new target consists of residues 14–119 of one monomer and 120–217 of the other monomer in the dimer structure. Notice that the swapped part makes up nearly half of the full domain. For T0747, residues 24–33 were unswapped and the linker residues 34–43 that connect the swapped and unswapped parts were omitted. We call such unswapped created structures D9 to distinguish them from other natural domains, which are named D1, D2, etc.
(F) Open structures made of simple repeating units (Fig. 10)
Fig. 10.
T0678 (center left), T0695 (bottom) and T0741 (center right): open repeat structures. Each structure is rainbow-colored from N- to C- termini.
The repeating units in these structures are rather simple and the essence of the structure is in the connections and arrangement of these units. Several targets (T0650, T0653, T0671-D2, T0688, T0690, T0713) have the LRR fold, which is an example of this type of structure. These were classified as TBM targets, except for T0653, which was assigned both TBM and FM (see below).
There are three other structures of this type, in which the links between the repeating units appear to be flexible to varying extent. We considered the whole protein as one EU for these structures so that the relation between the repeating units may be evaluated.
T0678
This is a 7-helix α–α superhelix with a low pitch. Because of the low pitch, it may also be considered as an incomplete α–α toroid. Since both α–α superhelix and α–α toroid are well-known fold types, this target is classified as a TBM target.
The alignment plots suggested that predictors could find good templates for 3- or 4-helix bundles but not for the entire 7-helix superhelix, possibly because the conformation of the links between helices is variable. However, there is at least one reasonably good template for the whole structure (2rgkA), which is in the PSIBLAST hit list with a reasonably low E-value (3e-09) although rather low rank (108).
T0695
This is basically a 3-helix bundle repeated five or six (counting three short helices at the C-terminal end as another repeat) times to form a semi-circle. We considered this as a single EU because breaking this into five or six 3-helix bundles is nearly equivalent to deleting this interesting structure from the target list. This is an FM target for two reasons: (1) Although there are surely template structures for individual repeating units (e.g., d1u00a1), we could not find any structure in which the repeating units were arranged in the manner found in this target structure; and (2) this target demands visual inspection for evaluation because of the possibility of the flexibility between the repeating units.
T0741
This is made of two long 2-stranded twisted β-ribbons (D1: residues 79-113 and D2: 121-149) that protrude like ears from a central domain of two 3-stranded β-sheets (D3: residues 46-78/114-120/150-181). Again, to evaluate the models for this structure solely in terms of the isolated three domains would amount to ignoring the unique arrangement of the three domains found in this structure. We again considered the whole protein as one EU even though we realized that individual domains, as well as the relation between them, are likely to be flexible. This is an FM target, as it also requires visual inspection for evaluation.
NON-TRIVIAL CLASSIFICATIONS
Classification of domains is tightly connected with their definition as both procedures rely on the availability of templates suitable for modeling.
In order to see if a potential template structure existed for a target, we ran structural similarity searches using LGA22,28 and Mammoth28 (run by the Prediction Center) and TMalign23 (run by Lee’s group) as the target structure became available (see above). To see if any templates could have been found using sequence alone, sequence homologue searches were made against sequence and structural databases using HHpred29 and PSIBLAST30 (Prediction Center) and BLASTP31 and Pfam32 (Lee’s group). Good template structures could indeed be found by sequence searches alone for a large majority of EUs, which were therefore classified as TBM targets. As mentioned in the preceding section, some of these EUs contain more than one domain.
Among the EUs that were classified as FM targets, no convincingly similar template could be found for four (T0666, T0737-D1, T0739-D1, T0739-D2), possible template existed but had poor structural and sequence similarity for three (T0719-D6, T0735-D2, T0740), and a fair template existed, which however could not be found by sequence similarity searches, for two others (T0658-D1, T0684-D2).
Classification of the remaining, more unusual EUs has already been described in the preceding section. All EUs with the D0 designation were classified as “other” targets, but effectively treated as FM targets.
There is one other unusual structure that needs to be mentioned. T0653 is an LRR, which is bent in such a way that the β-sheet side of the helical structure is convex. Most, if not all, known LRRs have the β-sheet side concave. Good prediction models have the LRR fold but bent in the usual way and have low GDT scores. This can be a TBM target since modelers apparently used one or more LRR templates, but also an FM target since proper template does not exist or predictors used a similar, but wrong, template. We decided to evaluate this target both as a TBM and as an FM target. The evaluation of this as an FM target would focus on the prediction of the correct bend.
RESULTS
A summary table of the boundaries and classifications of all evaluation units can be found at the Prediction Center web site, http://predictioncenter.org/casp10/domains_summary.cgi/. The TBM-hard designation in this table refers to the TBM targets with the maximum GDT-TS score less than 50.
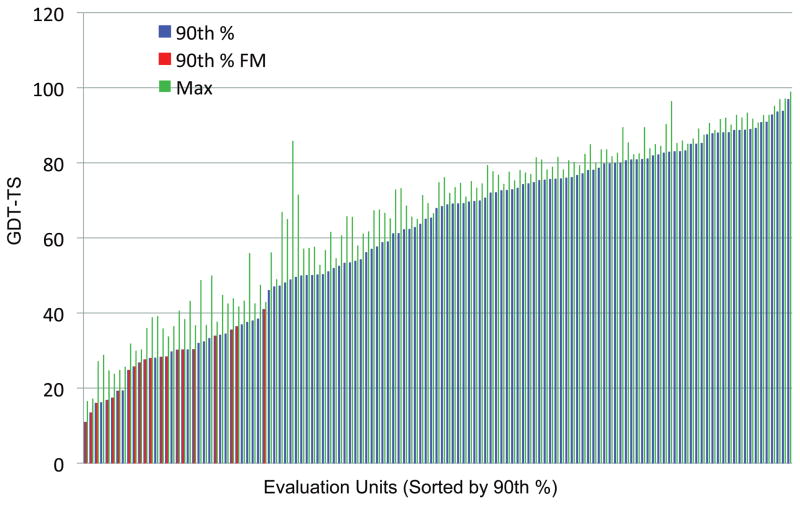
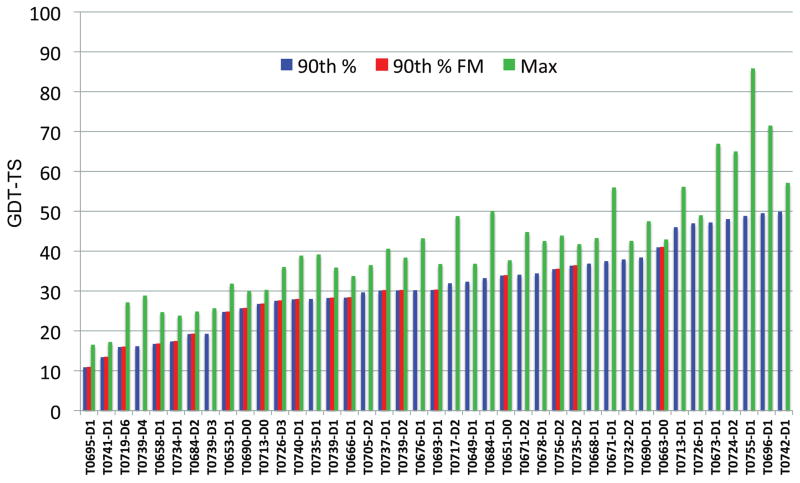
Fig. 11 shows the maximum (green bars) and 90th percentile (blue and red bars) GDT-TS scores of all target EUs sorted in increasing order of the 90th percentile GDT-TS score (90pGDT). We used the 90th percentile score in order not to be biased by the presence of a few extraordinarily good predictions. We note that there is a small jump in 90pGDT value at around 45 and that all FM targets (red bars) have 90pGDT values less than 45. Fig. 12 shows a magnified view, which shows only those with 90pGDT score less than 50.
Fig. 11.
GDT-TS scores for all targets sorted in increasing order of 90th percentile GDT_TS score.
Fig. 12.
Magnified view of Fig. 11 showing targets with 90th percentile GDT-TS score less than 50.
Most of the EUs with the 90pGDT score at or below 30 are FM targets. There are five exceptions. T0739-D3 and T0739-D4 are both large β-helices with three strands per turn. This fold is certainly not new. Many of the good models for these domains have this basic fold and strongly suggest that they were built using templates. The generally low GDT scores must arise from the difficulty of obtaining the correct alignment possibly due to the similarities among sequences of the many β-strand repeats and to the occasional non-β-helical insertions in the structure. T0735-D1 is clearly similar to the N-terminal domain of leukotriene A4 hydrolase, 3b7s. This is a large (233 residues) β-sandwich structure that contains many turns, at which the structure deviates from that in the template. Generally, we have observed that GDT scores tend to be high for helical structures and low for the β-structures. T0705-D2 is a 6-bladed β-propeller. The GDT scores are low, presumably because only few residues make up the strands and many residues are in the loops, whose structure is variable. T0676 is a 5-stranded β-sheet plus a couple of helices. Several structures including 2lpx and 2ldk are good templates except that they have two extra strands that expand the β-sheet in the structure. This is again a predominantly β-structure, which may have suppressed the GDT score. But the maximum GDT score is above 40.
There are four EUs in the FM category whose 90pGDT is greater than 30. Two of these have D0 designations; their relatively high GDT score is understandable since a large portion of the whole structure is made of TBM domains. The relatively high 90pGDT score for the dimerization domain T0756-D2 (see above) is probably due to the fact that the structure is small and contains two helices. The only templates found for T0735-D2 were poorly similar in structure and in sequence and appeared non-specific (see above). The 90pGDT score is relatively high presumably because this is an entirely helical structure.
DISCUSSION AND CONCLUSION
As pointed out earlier, previous assessors have already recognized that evaluation units need not be the same as the conventional domain units and combined two or more domains into one EU when there was a spanning template. In CASP10, prompted by the unusual domain arrangement in T0663 and by the existence of two kinked LRR structures (T0690 and T0713), we went one step further by combining two or more sub-structures into one EU in cases where the inter-domain arrangement was unique and the most interesting feature of the structure. The assessment is to be done by visual inspection both because there is no template structure that has such inter-domain arrangement (Free Modeling target) and because there is the possibility that the domain interface is flexible to some extent. This was done in the hope of recognizing correct predictions of the special domain arrangements in these structures, but it appears that the prediction of inter-domain relation remains difficult. (See the accompanying article on FM assessment in this issue.)
Although template-based and template-free modeling techniques are distinctly different, it is difficult, if not impossible, to classify targets based on the modeling technique actually used. This is partly because many groups use full or partial template structures whenever they can be found and then switch to free modeling procedure for the stretches for which a template structure cannot be found. The template structure can come from known structures in PDB or from the predicted structures provided by prediction servers. When the region without a useable template is a substantial portion of the target, such procedures cannot be cleanly classified into template-based or free modeling. The problem of figuring out which technique a predictor used is exacerbated because the assessors do not know the identity of the predictors at the time the classification is made. We based our classifications mainly on the properties of the target itself (whether a sequence-searchable template exists) and on whether the predictions are expected to require visual inspection for evaluation. We recognize that it is possible to obtain relatively good results on an FM target by template-based modeling technique, particularly when all models are poor in quality, either by using a remotely similar template or by using server predictions as the template. (See the accompanying article on FM assessment in this issue). It seems futile to try to identify targets for which only the truly template-free modeling technique will excel. We suggest that we must consider abandoning classifying the targets on the basis of the modeling technique expected to be used and rather consider classification by the suitability of the particular assessment technique (visual vs. non-visual) to be used.
Of the 131 evaluation units, we judged that there were useable templates for 111, which therefore are not new folds. Of the 20 EUs that we classified as FM targets, three (T0651-D0, T0693-D1, T0726-D3) are basically decorations on, or a linker between, other domains; nine (T0695, T0741, T0653, T0690-D0, T0713-D0, T0734, T0666-D1, T0663-D0, T0740) have substructures that are of familiar fold but arranged in a novel manner; one (T0756-D2) is an incomplete domain, which becomes a complete domain of familiar fold upon dimerization; and remotely similar templates could be found for four others (T0658-D1, T0684-D2, T0719-D6, T0735-D2). Only the remaining three (T0737-D1, T0739-D1, T0739-D2) have potentially new folds.
Acknowledgments
We thank the experimental groups who provided the target structures. We also thank Drs. J. Aramini, B. Mao, R. Tejero, and D. Snyder for helpful discussions. Molecular graphics and analyses were performed with the UCSF Chimera package33 and by using KiNG12 in conjunction with MolProbity11. Chimera is developed by the Resource for Biocomputing, Visualization, and Informatics at the University of California, San Francisco (supported by NIGMS P41-GM103311). KiNG and MolProbity are developed by the laboratory of David and Jane Richardson at Duke University. This research was partially supported by the Intramural Research Program of the NIH, National Cancer Institute and by US National Institute of General Medical Sciences grants U54-GM094597 (to G.T.M.) and RO1-GM100482(to A.K.).
Contributor Information
Todd J. Taylor, Email: compbiology@yahoo.com.
Chin-Hsien Tai, Email: taic@mail.nih.gov.
Yuanpeng J. Huang, Email: yphuang@cabm.rutgers.edu.
Jeremy Block, Email: jeremy.block@gmail.com.
Hongjun Bai, Email: hongjun.bai@nih.gov.
Andriy Kryshtafovych, Email: akryshtafovych@ucdavis.edu.
Gaetano T. Montelione, Email: guy@cabm.rutgers.edu.
Byungkook Lee, Email: bk@nih.gov.
References
- 1.Tai C-H, Bai H, Taylor T, Lee B. Assessment of template free modeling in CASP10 and ROLL. Proteins. 2013 doi: 10.1002/prot.24470. This issue. [DOI] [PMC free article] [PubMed] [Google Scholar]
- 2.Veretnik S, Bourne PE, Alexandrov NN, Shindyalov IN. Toward consistent assignment of structural domains in proteins. J Mol Biol. 2004;339(3):647–678. doi: 10.1016/j.jmb.2004.03.053. [DOI] [PubMed] [Google Scholar]
- 3.Veretnik S, Gu J, Wodak SJ. Identifying structural domains in proteins. In: Gu J, Bourne PE, editors. Structural Bioinformatics. 2. Hoboken, N.J: John Wiley & Sons, Inc; 2009. pp. 485–513. [Google Scholar]
- 4.Zhou H, Xue B, Zhou Y. DDOMAIN: Dividing structures into domains using a normalized domain-domain interaction profile. Protein science: a publication of the Protein Society. 2007;16(5):947–955. doi: 10.1110/ps.062597307. [DOI] [PMC free article] [PubMed] [Google Scholar]
- 5.Xu Y, Xu D, Gabow HN. Protein domain decomposition using a graph-theoretic approach. Bioinformatics. 2000;16(12):1091–1104. doi: 10.1093/bioinformatics/16.12.1091. [DOI] [PubMed] [Google Scholar]
- 6.Guo JT, Xu D, Kim D, Xu Y. Improving the performance of Domain Parser for structural domain partition using neural network. Nucleic Acids Res. 2003;31(3):944–952. doi: 10.1093/nar/gkg189. [DOI] [PMC free article] [PubMed] [Google Scholar]
- 7.Alexandrov N, Shindyalov I. PDP: protein domain parser. Bioinformatics. 2003;19(3):429–430. doi: 10.1093/bioinformatics/btg006. [DOI] [PubMed] [Google Scholar]
- 8.Clarke ND, Ezkurdia I, Kopp J, Read RJ, Schwede T, Tress M. Domain definition and target classification for CASP7. Proteins. 2007;69 (Suppl 8):10–18. doi: 10.1002/prot.21686. [DOI] [PubMed] [Google Scholar]
- 9.Kinch LN, Shi S, Cheng H, Cong Q, Pei J, Mariani V, Schwede T, Grishin NV. CASP9 target classification. Proteins. 2011;79 (Suppl 10):21–36. doi: 10.1002/prot.23190. [DOI] [PMC free article] [PubMed] [Google Scholar]
- 10.Tress ML, Ezkurdia I, Richardson JS. Target domain definition and classification in CASP8. Proteins. 2009;77 (Suppl 9):10–17. doi: 10.1002/prot.22497. [DOI] [PMC free article] [PubMed] [Google Scholar]
- 11.Davis IW, Leaver-Fay A, Chen VB, Block JN, Kapral GJ, Wang X, Murray LW, Arendall WB, 3rd, Snoeyink J, Richardson JS, Richardson DC. MolProbity: all-atom contacts and structure validation for proteins and nucleic acids. Nucleic Acids Res. 2007;35(Web Server issue):W375–383. doi: 10.1093/nar/gkm216. [DOI] [PMC free article] [PubMed] [Google Scholar]
- 12.Chen VB, Davis IW, Richardson DC. KING (Kinemage, Next Generation): a versatile interactive molecular and scientific visualization program. Protein science: a publication of the Protein Society. 2009;18(11):2403–2409. doi: 10.1002/pro.250. [DOI] [PMC free article] [PubMed] [Google Scholar]
- 13.Bhattacharya A, Tejero R, Montelione GT. Evaluating protein structures determined by structural genomics consortia. Proteins. 2007;66(4):778–795. doi: 10.1002/prot.21165. [DOI] [PubMed] [Google Scholar]
- 14.Bhattacharya A, Wunderlich Z, Monleon D, Tejero R, Montelione GT. Assessing model accuracy using the homology modeling automatically software. Proteins. 2008;70(1):105–118. doi: 10.1002/prot.21466. [DOI] [PubMed] [Google Scholar]
- 15.Snyder DA, Bhattacharya A, Huang YJ, Montelione GT. Assessing precision and accuracy of protein structures derived from NMR data. Proteins. 2005;59(4):655–661. doi: 10.1002/prot.20499. [DOI] [PubMed] [Google Scholar]
- 16.Snyder DA, Montelione GT. Clustering algorithms for identifying core atom sets and for assessing the precision of protein structure ensembles. Proteins. 2005;59(4):673–686. doi: 10.1002/prot.20402. [DOI] [PubMed] [Google Scholar]
- 17.Block JN, Zielinski DJ, Chen VB, Davis IW, Vinson EC, Brady R, Richardson JS, Richardson DC. Kin Immerse: Macromolecular VR for NMR ensembles. Source code for biology and medicine. 2009;4:3. doi: 10.1186/1751-0473-4-3. [DOI] [PMC free article] [PubMed] [Google Scholar]
- 18.Snyder DA, Grullon J, Huang YJ, Tejero R, Montelione GT. The expanded find Core method for identification of a core atom set for assessment of protein structure prediction. Proteins. 2013 doi: 10.1002/prot.24490. This issue. [DOI] [PMC free article] [PubMed] [Google Scholar]
- 19.Berman HM, Westbrook J, Feng Z, Gilliland G, Bhat TN, Weissig H, Shindyalov IN, Bourne PE. The Protein Data Bank. Nucleic Acids Res. 2000;28(1):235–242. doi: 10.1093/nar/28.1.235. [DOI] [PMC free article] [PubMed] [Google Scholar]
- 20.Li W, Godzik A. Cd-hit: a fast program for clustering and comparing large sets of protein or nucleotide sequences. Bioinformatics. 2006;22(13):1658–1659. doi: 10.1093/bioinformatics/btl158. [DOI] [PubMed] [Google Scholar]
- 21.Ortiz AR, Strauss CE, Olmea O. MAMMOTH (matching molecular models obtained from theory): an automated method for model comparison. Protein science: a publication of the Protein Society. 2002;11(11):2606–2621. doi: 10.1110/ps.0215902. [DOI] [PMC free article] [PubMed] [Google Scholar]
- 22.Zemla A. LGA: A method for finding 3D similarities in protein structures. Nucleic Acids Res. 2003;31(13):3370–3374. doi: 10.1093/nar/gkg571. [DOI] [PMC free article] [PubMed] [Google Scholar]
- 23.Zhang Y, Skolnick J. TM-align: a protein structure alignment algorithm based on the TM-score. Nucleic Acids Res. 2005;33(7):2302–2309. doi: 10.1093/nar/gki524. [DOI] [PMC free article] [PubMed] [Google Scholar]
- 24.Wang G, Dunbrack RL., Jr PISCES: a protein sequence culling server. Bioinformatics. 2003;19(12):1589–1591. doi: 10.1093/bioinformatics/btg224. [DOI] [PubMed] [Google Scholar]
- 25.Kryshtafovych A, Monastyrskyy B, Fidelis K. CASP Prediction Center infrastructure and evaluation measures in CASP10 and CASP ROLL. Proteins. 2013 doi: 10.1002/prot.24399. This issue. [DOI] [PMC free article] [PubMed] [Google Scholar]
- 26.Enkhbayar P, Kamiya M, Osaki M, Matsumoto T, Matsushima N. Structural principles of leucine-rich repeat (LRR) proteins. Proteins. 2004;54(3):394–403. doi: 10.1002/prot.10605. [DOI] [PubMed] [Google Scholar]
- 27.Liu Y, Eisenberg D. 3D domain swapping: as domains continue to swap. Protein science: a publication of the Protein Society. 2002;11(6):1285–1299. doi: 10.1110/ps.0201402. [DOI] [PMC free article] [PubMed] [Google Scholar]
- 28.Lupyan D. A new progressive-iterative algorithm for multiple structure alignment. Bioinformatics. 2005;21(15):3255. doi: 10.1093/bioinformatics/bti527. [DOI] [PubMed] [Google Scholar]
- 29.Soding J, Biegert A, Lupas AN. The HHpred interactive server for protein homology detection and structure prediction. Nucleic Acids Res. 2005;33(Web Server issue):W244–248. doi: 10.1093/nar/gki408. [DOI] [PMC free article] [PubMed] [Google Scholar]
- 30.Altschul SF, Madden TL, Schaffer AA, Zhang J, Zhang Z, Miller W, Lipman DJ. Gapped BLAST and PSI-BLAST: a new generation of protein database search programs. Nucleic Acids Res. 1997;25(17):3389–3402. doi: 10.1093/nar/25.17.3389. [DOI] [PMC free article] [PubMed] [Google Scholar]
- 31.Johnson M, Zaretskaya I, Raytselis Y, Merezhuk Y, McGinnis S, Madden TL. NCBI BLAST: a better web interface. Nucleic Acids Res. 2008;36(Web Server issue):W5–9. doi: 10.1093/nar/gkn201. [DOI] [PMC free article] [PubMed] [Google Scholar]
- 32.Finn RD, Mistry J, Schuster-Bockler B, Griffiths-Jones S, Hollich V, Lassmann T, Moxon S, Marshall M, Khanna A, Durbin R, Eddy SR, Sonnhammer EL, Bateman A. Pfam: clans, web tools and services. Nucleic Acids Res. 2006;34(Database issue):D247–251. doi: 10.1093/nar/gkj149. [DOI] [PMC free article] [PubMed] [Google Scholar]
- 33.Pettersen EF, Goddard TD, Huang CC, Couch GS, Greenblatt DM, Meng EC, Ferrin TE. UCSF Chimera--a visualization system for exploratory research and analysis. Journal of computational chemistry. 2004;25(13):1605–1612. doi: 10.1002/jcc.20084. [DOI] [PubMed] [Google Scholar]


