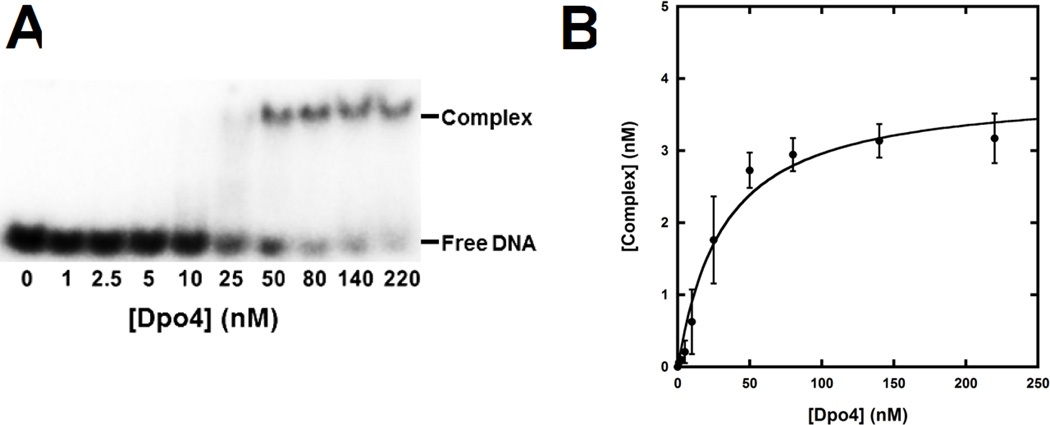
Figure 3. Determination of Kd, DNA.
(A) A gel image shown the formation of the binary complex Dpo4•DNA during titration. Dpo4 (0 – 220 nM) was titrated into a solution containing 5′-32P-labeled 21/26-mer-dGC8-N-ABA (5 nM). The binary complex of Dpo4•DNA was separated from free DNA by native PAGE. The titration was repeated four times. (B) Plot of the binary complex concentration versus the total concentration of Dpo4. Each error bar represents the standard deviation of a complex concentration based on four independent experiments. The data were fit to Equation 1 (see 2.2.4.) which yielded a Kd, DNA of 29 ± 7 nM.

