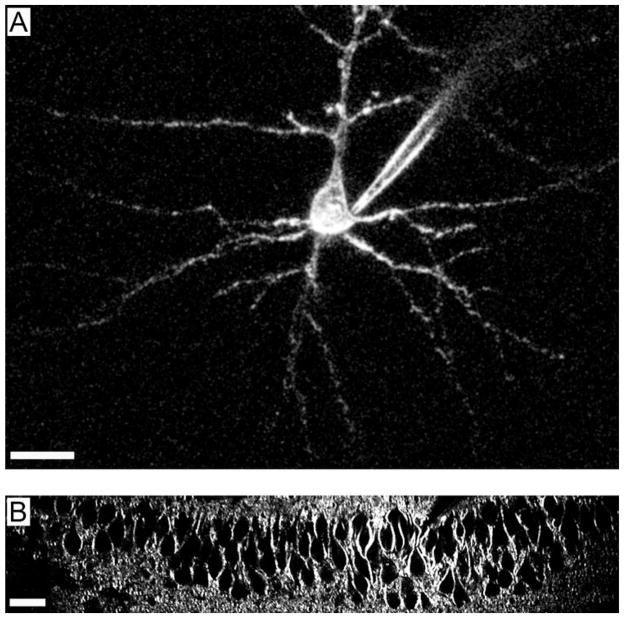
Figure 1.
Single neuron and cell population SHG imaging. A: SHG image of a layer 5 pyramidal neuron from mouse visual cortex, injected with the chromophore FM-4-64. The SHG signal outlines the plasma membrane and the dendrites of the cell are clearly visible. B: SHG image of a field of pyramidal neurons in the CA1 region of the hippocampus. The cells were labeled by bath application of a SHG chromophore. Dozens of cell bodies are visible. Scale bars: 20 μm.

