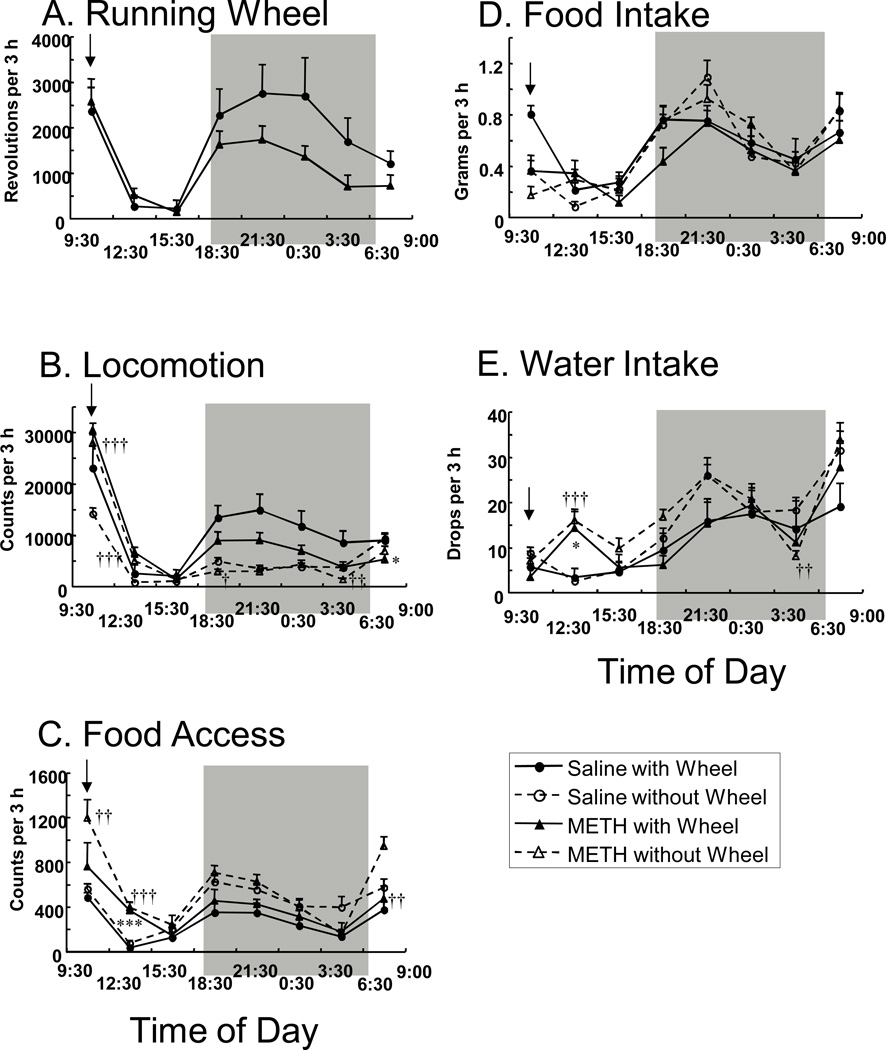
Fig. 2.
Effect of acute METH (or saline) challenge on mouse behavior. (A) Running wheel activity, (B) horizontal locomotion, (C) food access (access frequency to a food container), (D) food intake and (E) water intake after acute saline or 1.0 mg/kg methamphetamine challenge at 09:30. Data are presented as 3-h bins. Values are shown as the means ± SEM (n = 10 per group). Arrows indicate the time-point of METH (or saline) injection. Gray zones represent the dark period (19:00-07:00). *P < 0.05, ***P < 0.001, compared with saline-injected mice exposed to a running wheel (t-test). ††P < 0.01, †††P < 0.001, compared with saline-injected mice without a running wheel (t-test).

