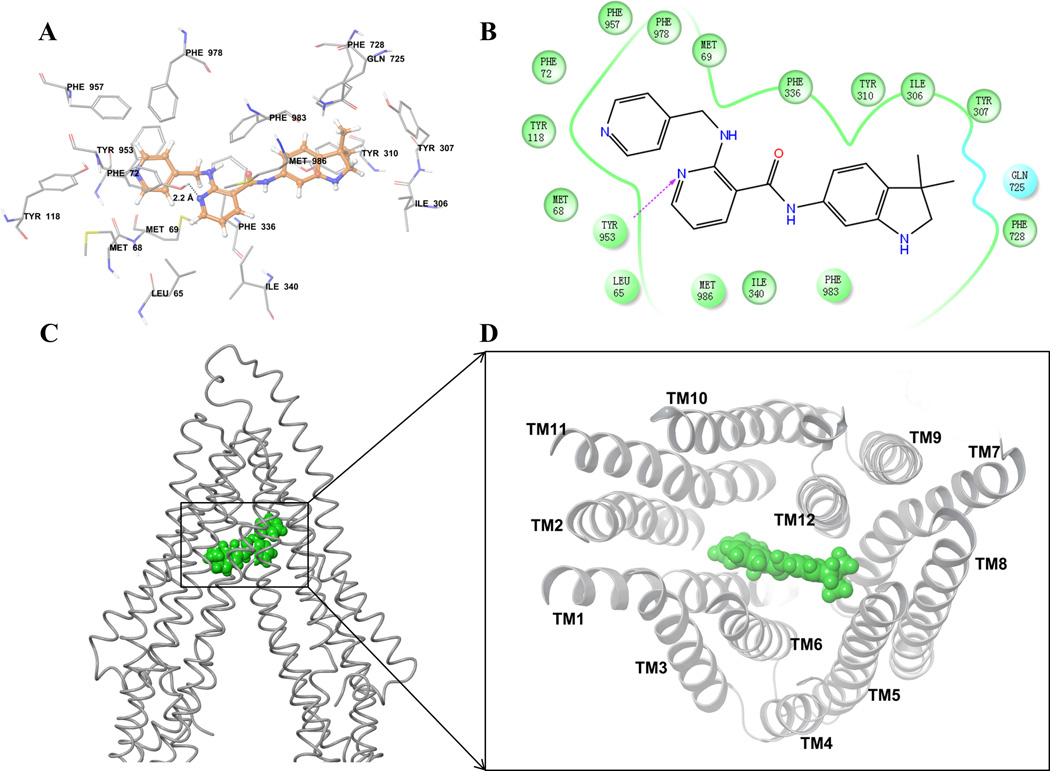
Figure 5. Docking analysis with human ABCB1 homology model.
(A) XP-Glide predicted binding model of motesanib with the homology modeled human ABCB1. Important amino acids are depicted as sticks with the atoms colored as carbon – green, hydrogen – white, nitrogen –blue, oxygen – red, whereas motesanib is shown with the same color scheme as above except carbon atoms are represented in orange. Dotted black line indicates hydrogen bond. (B) A two dimensional ligand-receptor interaction diagram with important interactions observed in the docked complex of motesanib with the drug-binding site residues of human ABCB1 is shown. Residues are shown as colored bubbles, cyan indicates polar and green indicates hydrophobic residues. Hydrogen bond is shown by purple dotted arrow. (C) Binding of motesanib on ABCB1. Location of motesanib (green spheres) is shown in the ABCB1 internal large cavity. (D) Stereo images showing interactions of transmembrane helices with motesanib (green spheres) viewed from the intracellular side of the protein looking into the internal chamber.

