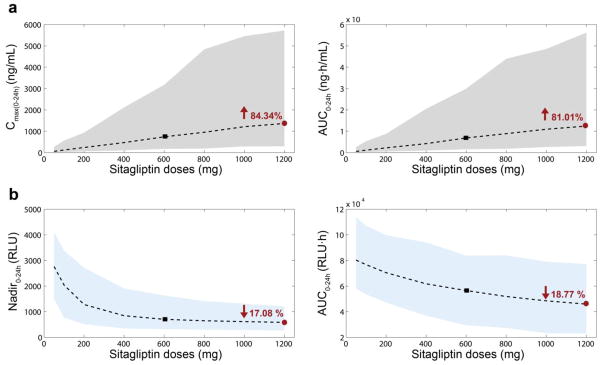
Fig. 5.

Changes in pharmacokinetic/pharmacodynamic descriptors depending on the dose amount. One thousand individuals were simulated per dose. Doses simulated were 50, 100, 200, 400, 600, 800, 1000 and 1200mg (X axis). Two pharmacokinetic descriptors were calculated (a): Cmax(0-24h) (ng/mL) (left) and AUC0-24h (ng·h/mL) (right). Two pharmacodynamic descriptors were calculated (b): Nadir0-24h (RLU) (left) and AUC0-24h (RLU·h) (right). Shaded areas correspond to the 90% prediction interval for the pharmacokinetics (grey) and the pharmacodynamics (blue) descriptors. Dashed lines represent the medians. Black squares indicate the median values for the reference dose −600mg (OD). Red circles correspond to twice the reference dose −1200mg (OD); values in red are the corresponding increment/decrement (%) with respect to the reference dose (black square). AUC0–24 area under the concentration time curve from 0 to 24 h, Cmax(0–24h) maximum concentration from 0 to 24 hours, OD once daily, RLU relative light units
