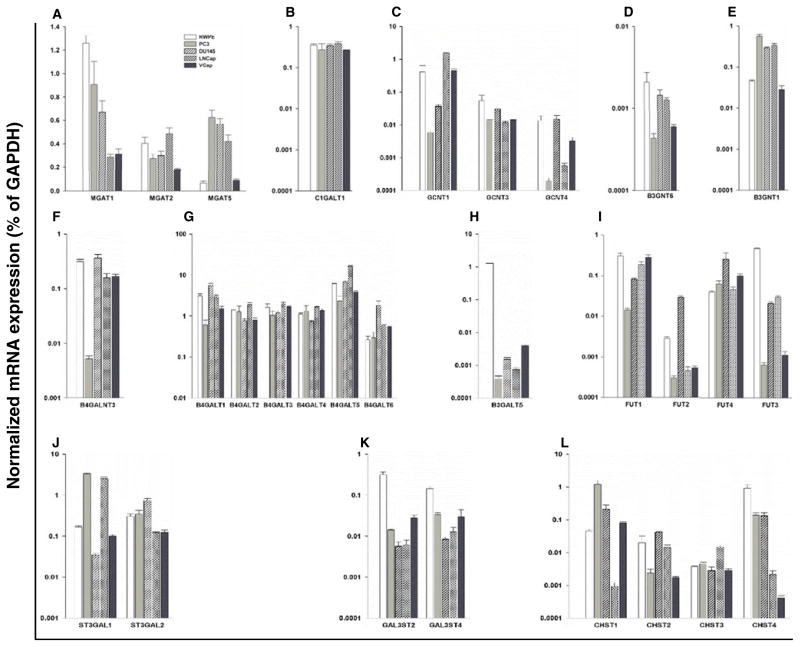
Fig. 2.
Quantitative real-time PCR analysis of the mRNAs of glycosyltransferase and sulfotransferase genes in normal and cancerous prostatic cells. The expression levels of glycosyltransferase and sulfotransferase genes are shown, which corresponded to the enzymatic activities measured in this study. The gene expression levels were calculated by the ΔCt method as described in Materials and Methods and expressed as relative amount to that of GAPDH (100 %). The enzyme names are listed in Table 1. Results are shown for a MGAT1, 2, 5; (GnT-I, II, V); b C1GALT1 (C1GalT); c GCNT1,3,4 (C2GnT1-3); d B3GNT6 (Core 3 Synthase); e B3GNT1 (Extension β3GlcNAcT); f B4GALNT3 (β4GalNAcT); g B4GALT1-6 (β4GalT); h B3GALT5 (β3GalT5); i FUT1-4; j ST3GAL1-2; k sulfotransferases GAL3ST2 & 4; and l sulfotransferases CHST1-4. The data were obtained from three independent experiments and expressed as mean ± SEM

