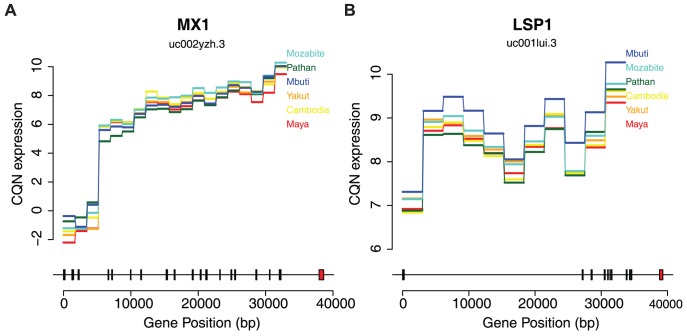
Figure 3. Differential expression across human populations.
Bottom plots show exon positions indicated by rectangles to physical position scale. Red rectangles are differentially expressed exons. Upper plots show the median conditionally quantile normalized (CQN) expression values per population of each exon in horizontal lines. Diagonal lines connect each exon. Each exon corresponds one-to-one with the transcript structure shown below but have been scaled evenly to the width of the plot for ease of visualization. Population orders on the right correspond with the order of expression values of the last exon. A) Expression by population of the uc002yzh.3 transcript of MX1. B) Expression by population of the uc001lui.3 transcript of LSP1.

