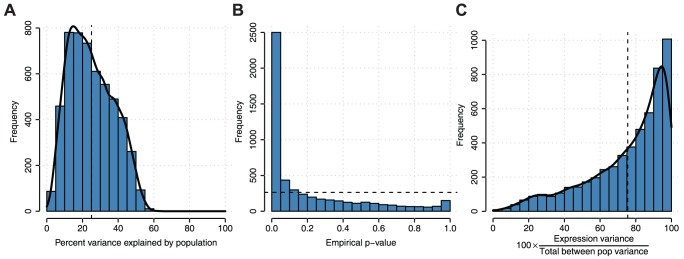
Figure 5. Analysis of variation in gene expression and splicing among individuals attributable to population labels.

A) Distribution of percent variance explained by population across n = 5,334 expressed genes with ≥2 transcripts expressed across all individuals. B) Empirical p-values for genes in part A. P-values were calculated by permuting population labels for individuals 100 times and comparing to true population labels. Dashed line indicates the uniform p-value distribution expected under the null hypothesis of no association between population label and expression. The output from the multiplicative model can be interpreted similarly to an R2 coefficient of a linear model. C) The contribution of gene expression in the variance explained by the population.
