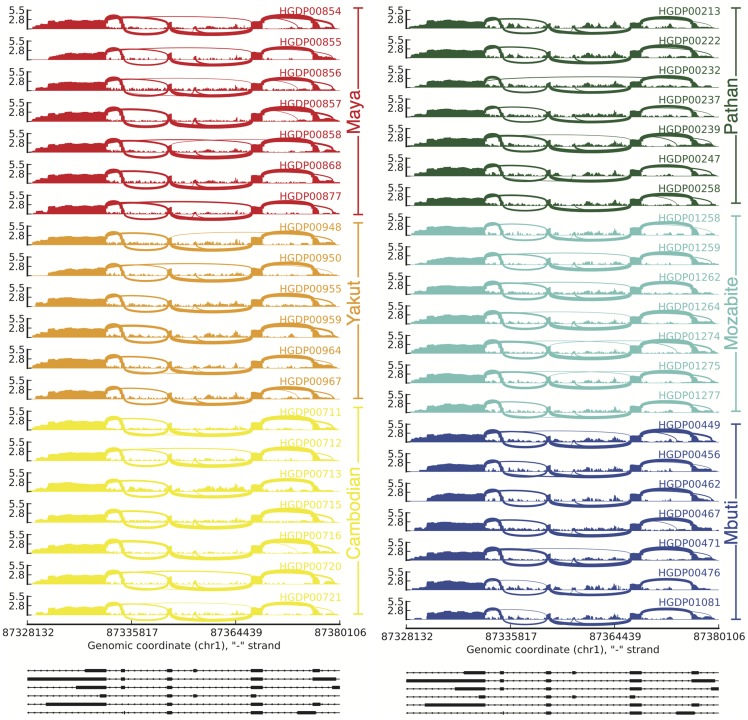
Figure 6. Splicing variability across human populations.
Each sashimi plot shows the expression within an individual for a differentially spliced gene (ENSG00000183291.11, SEP15). The RNA-seq read densities supporting expression over the region as well as the inclusion and exclusion of exons are shown and line densities are proportional to reads supporting splicing events. The y-axis on each sashimi plot indicates the expression in log10 reads per kilobase per million reads (log10(RPKM)). The plots on the bottom show the transcript structure within the gene.

