
Figure 1. The structure of the Siekmann  model.
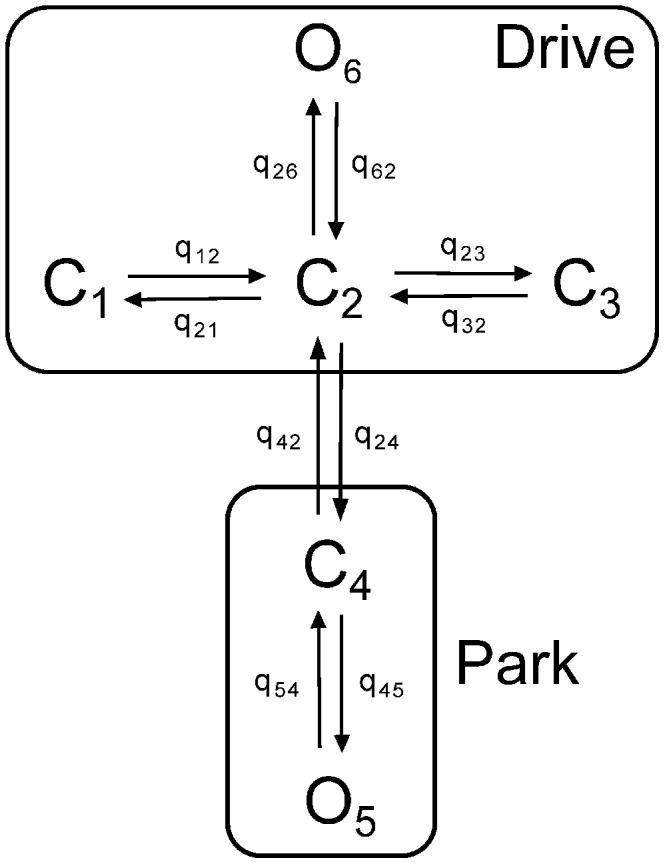
The  model is comprised of two modes. One is the drive mode containing three closed states
  ,
,  ,
,  and one open state
  . The other is the park mode which includes one closed state
  and one open state
  .
.  are rates of state-transitions between two adjacent states and
  and
and  are transitions between the two modes [7].