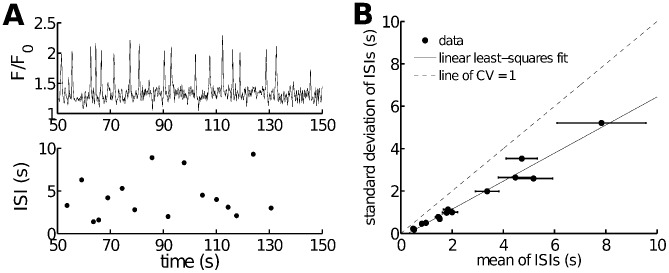
Figure 2.
 oscillations in ASMC in lung slices are generated by a stochastic mechanism.
A: experimental  spiking in ASMC in lung slices, stimulated with 50 nM MCh. In the upper panel we filter out baseline noise by using a low threshold of 1.42 (relative fluorescence intensity) and then choose samples with amplitude larger than 1.75. The ISI calculated from the upper panel is shown in the lower panel. B: relationship between the standard deviation and the mean of experimental ISIs. Data obtained from 14 ASMC in 5 mouse lung slices. The relationship is approximately linear with a slope of 0.66, which implies that an inhomogeneous Poisson process governs the generation of oscillations. The dashed line indicates where the coefficient of variation (CV) is 1 (as it is for a pure Poisson process). Variation in ISI is mainly caused by both use of different doses of MCh and different sensitivities of different cells to MCh. Error bars indicate the standard errors of the means (SEM).

