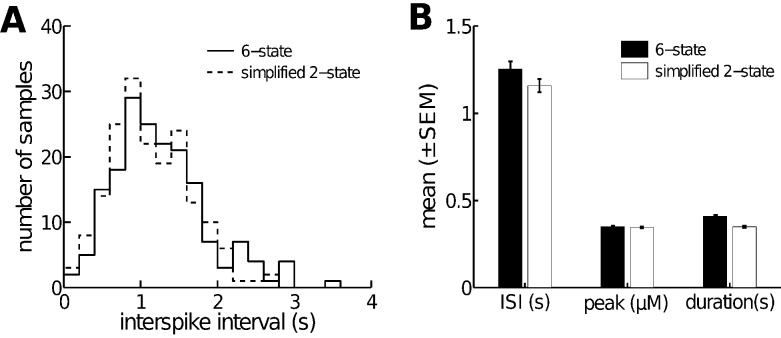
Figure 3. A 2-state open/closed model quantitatively reproduces the 6-state  model.
A: histograms of interspike interval (ISI) distribution for both the 6-state and the simplified models. The ISI is defined to be the waiting time between successive spikes. Each histogram contain an equal number of samples (180). B: comparison of average ISI, average peak value of  (
( in the model) and average spike duration. All distributions were computed at a constant
  .
.

