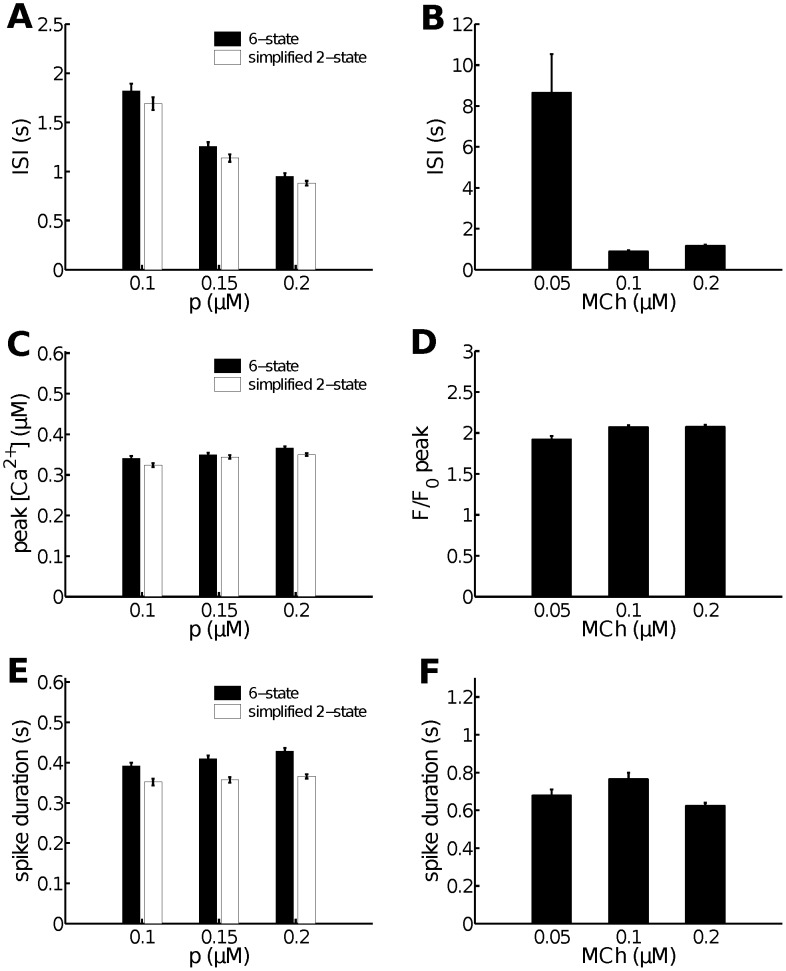
Figure 4. More detailed comparisons between the 2-state and the 6-state  models, and a comparison to experimental data.
As a function of  concentration (
 ), the two models give the same ISI (A), peak
  (C) and spike duration (E). These results agree qualitatively with experimental data, as shown in panels B, D and F respectively. Quantitative comparisons are generally not possible as the relationship between
  concentration and agonist concentration is not known. Error bars represent
  . Data for each MCh concentration are obtained from at least three different cells from at least two different lung slices.

