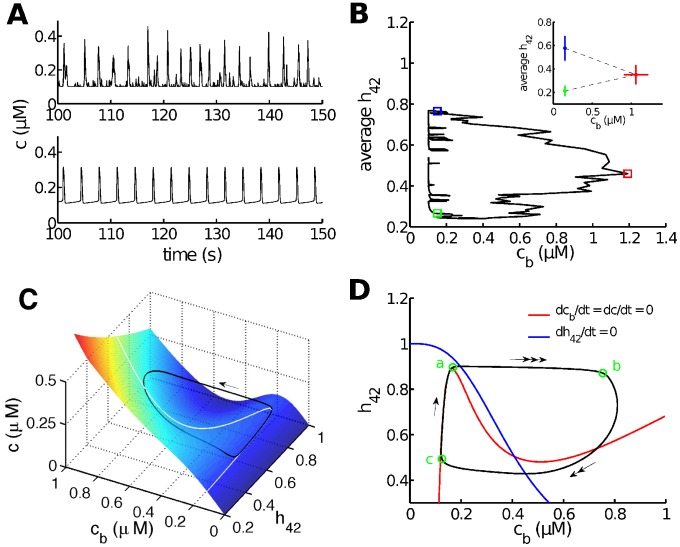
Figure 5. Stochastic and deterministic simulations exhibit similar dynamic properties.
A: simulated stochastic (upper panel) or deterministic (lower panel)  oscillations at
 . B: a typical stochastic solution projected on the
  plane. The average
  represents the average value of
  over the 20
  . Statistics (
 ) of the initiation point (blue square), the peak (red square) and termination point (green square) are shown in the inset. 116 samples are obtained by applying a low threshold of
  and a high threshold of
  to
to  . C: a typical periodic solution of the deterministic model (black curve), plotted in the
  phase space. The arrow indicates the direction of movement.
  is the slowest variable so that its variation during an oscillation is very small. This allows to treat
  as a constant (
 in this case) and study the dynamics of the model in the
  phase space. The color surface is the surface where
  (called the critical manifold). The white N-shaped curve is the intersection of the critical manifold and the surface
  . D: projection of the periodic solution to the
  plane. The red N-shaped curve is the projection to the
  plane of the white curve shown in C. The evolution of the deterministic solution exhibits three different time scales separated by green circles (labelled by a, b and c) and indicated by arrows (triple arrow: fastest; double arrow: intermediate; single arrow: slowest).

