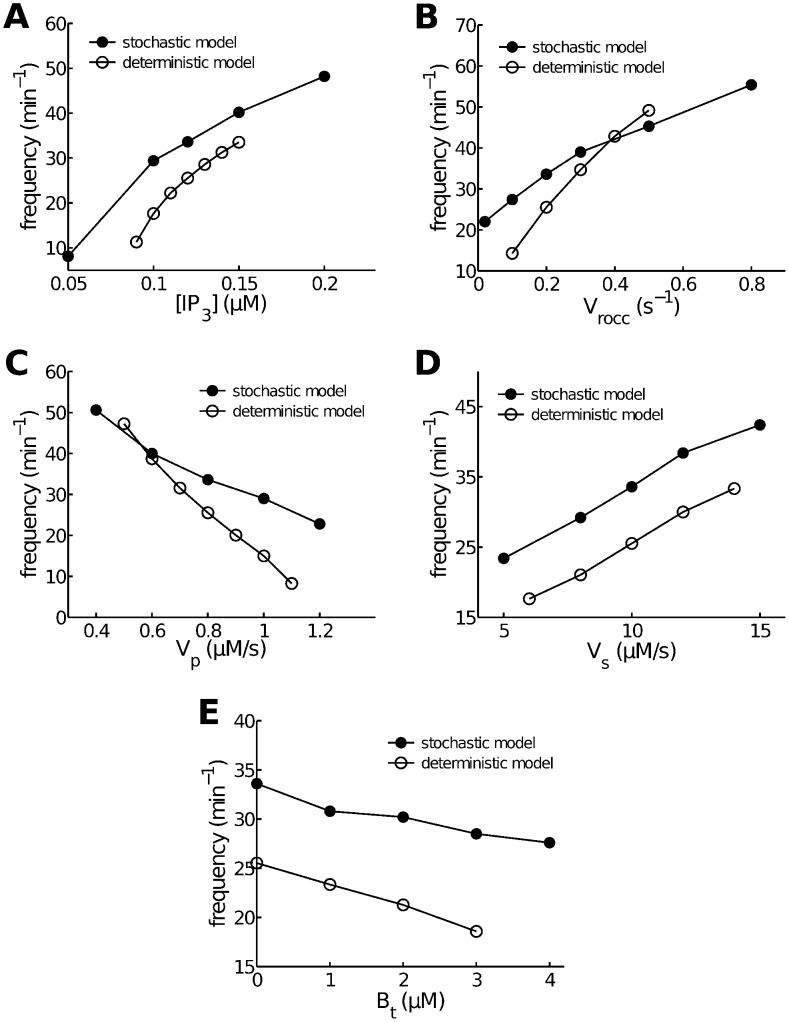
Figure 6. Comparison of parameter-dependent frequency changes in the stochastic and deterministic models.
All curves are computed at 
 except in panel A, which uses a variety of
  . Other parameters are set at their default values given in Table 1. A: as
  increases,
  oscillations in both models increase in frequency. B: as
  influx increases (modeled by an increase in receptor-operated calcium channel flux coefficient
  ), so does the oscillation frequency in both models. C: as
  efflux increases (modeled by an increase in plasma pump expression
  ), oscillation frequency decreases. D: as SERCA pump expression,
  , increases, so does oscillation frequency. E: as total buffer concentration,
  , increases, oscillation frequency decreases.

