
Figure 8. Schematic diagram of the  model.
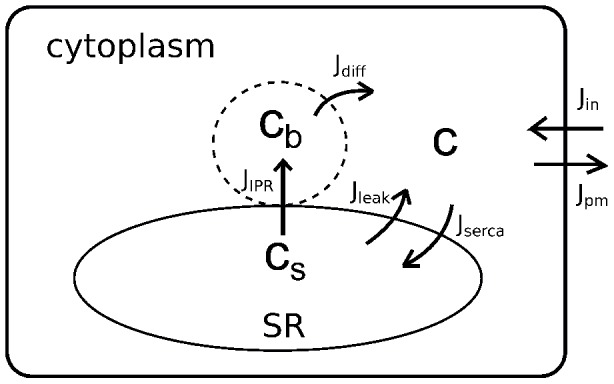
 represents cytoplasmic
  concentration, excluding a small local
  (whose concentration is denoted by
  ) close to the
  release site (i.e., an
  cluster). Upon coordinated openings of the
  , SR
, SR  (
( ) is first released into the local domain (
 ) to cause a rapid increase in
  . High local
  then diffuses to the rest of the cytoplasm (
 ), and is eventually pumped back to the SR (
 ).
).