
Figure 10. Open probability curves for various  .
.
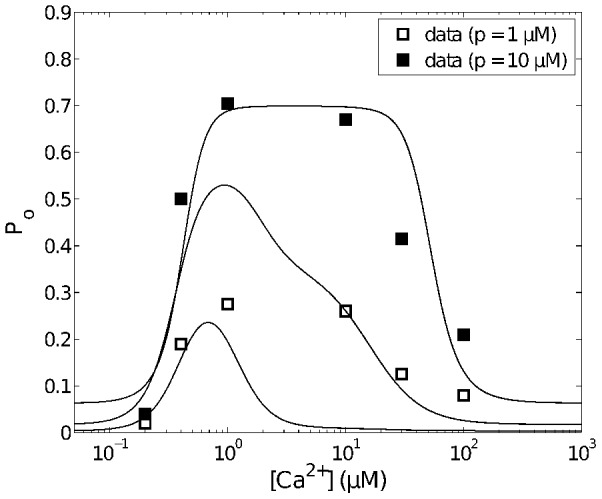
 is equal to the sum of probabilities of the
  in
in  and
and  . Three representative curves correspond to
  ,
,  and
and 
 (from bottom to top) respectively. Data (average open probability) are from [5].