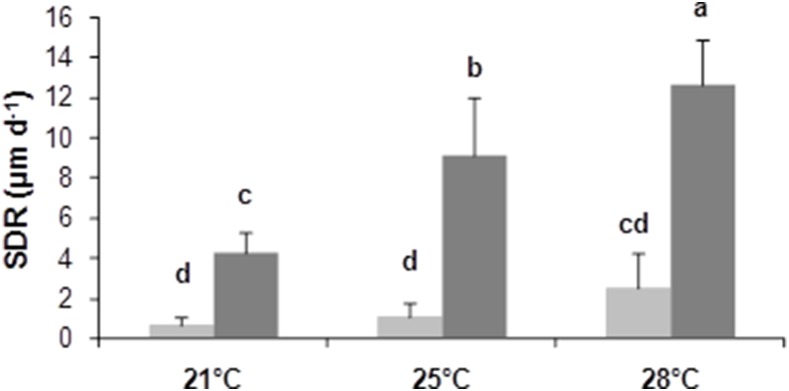
Figure 2. Shell deposit rate (µm.d−1) on the ventral side of the shell according to temperature and food concentrations over the two month experiment.

Three temperatures (21, 25 and 28°C) and two microalgal concentrations (800 cell mL−1: light grey and 15000 cell mL−1: darkgrey) were tested. The five homogeneous groups identified by the Tukey post-hoc test (a, b, c and d) are indicated (means and standard error, n = 10).
