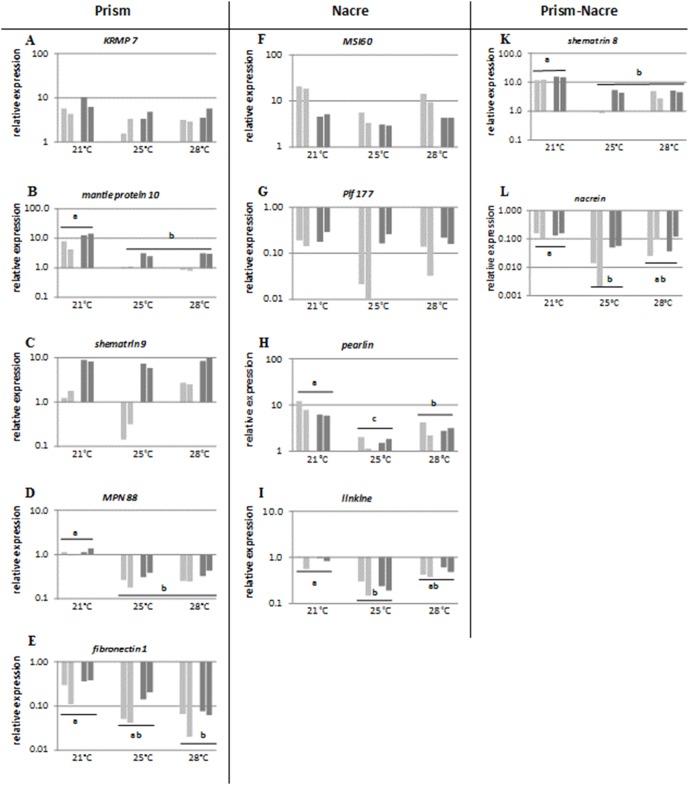
Figure 3. Relative gene expression of genes coding for proteins potentially involved in the construction of the prismatic layer (KRMP 7, mantle protein 10, shematrin 9, MPN88, fibronectin 1) the nacreous layer (MSI60, Pif 177, pearlin, linkine) and both the prismatic and the nacreous layers (shematrin 8, nacrein) following 2 months of exposure to 3 temperatures (21°C, 25°C and 28°C) and 2 microalgal concentrations 800 cell mL−1 for low food (LF) (light grey) and 15 000 cell mL−1 for high food (HF) (dark grey).
The results of two measures performed on a pool of 5 pearl oysters are shown for each condition. Statistical differences between temperatures are indicated by a letter.

