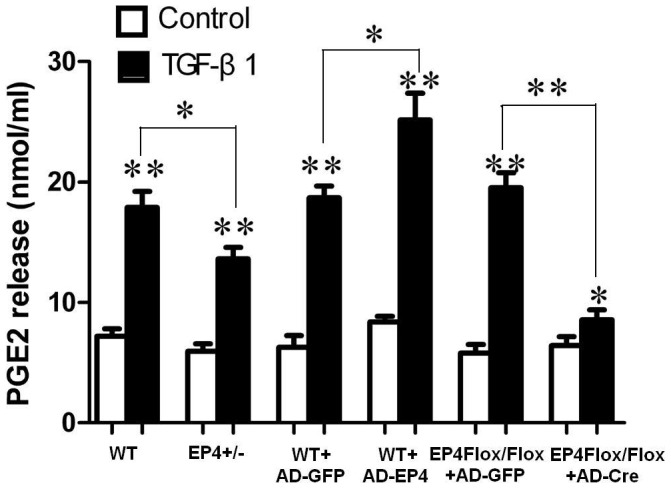
Figure 8. PGE2 Elisa analysis.

PGE2 levels in the cell supernatant of WT, EP4+/−, AD-GFP, AD-EP4, AD-GFP and AD-Cre mouse GMCs with or without TGF-β1 treatment. The values are means±standard deviations, the means and error bars are the result of biological replicates, *P<0.05, **P<0.01 vs Control group.
