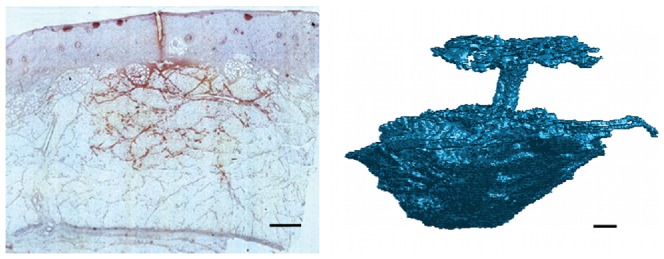
Figure 3. Histological cross section (left) and X-ray computed tomography scan (right) of similar subcutaneous injections.

The injections were performed in adipose pig tissue and the injected volume was 100 µL. For histology the insulin has been dyed to appear red in the light microscopy image. The segmented tomographic reconstruction shows the 3 dimensional extension of the injection depot together with the injection channel and the backflow at the skin surface. The contrast between the tissue and the injected fluid is obtained by mixing the insulin drug with an iodine based contrast agent. The scale bar is 1 mm.
