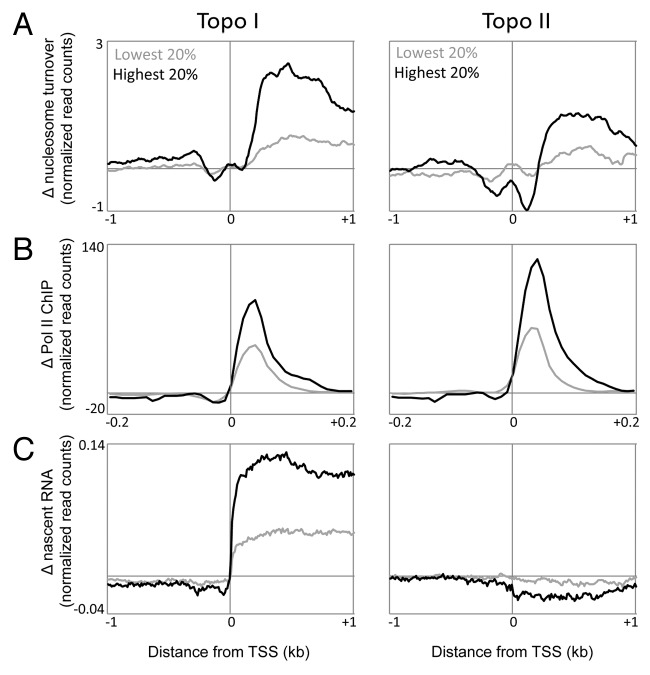
Figure 3. Torsional stress affects nucleosome dynamics and Pol II kinetics. Genes were grouped based on change in torsional stress as measured by change in TMP crosslinking before and after Topo I or II inhibition. The highest (High TD) and lowest (Low TD) 20% of genes are shown. For these two groups, the change in nucleosome turnover (A), the change in Pol II pausing (B), and the change in Pol II elongation as measured by nascent RNA production (C) are plotted for regions surrounding the TSS.

An official website of the United States government
Here's how you know
Official websites use .gov
A
.gov website belongs to an official
government organization in the United States.
Secure .gov websites use HTTPS
A lock (
) or https:// means you've safely
connected to the .gov website. Share sensitive
information only on official, secure websites.
