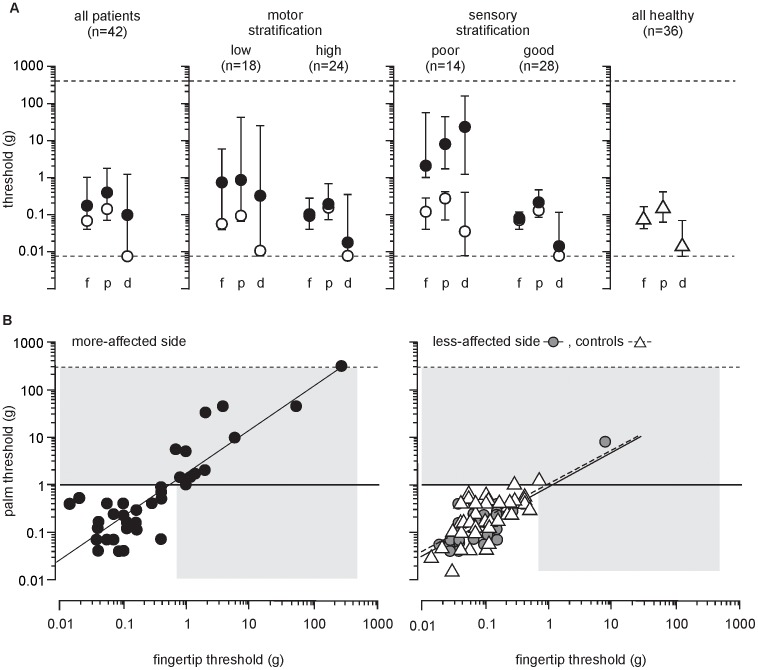
Figure 2. Cutaneous sensation after stroke and in age- and sex-matched healthy subjects A) Cutaneous sensation according to classification.
Higher numbers represent poorer sensation (higher thresholds), data presented as median and interquartile range on a logarithmic scale (log10). Dashed lines indicate minimum and maximum monofilament size (0.008–300 g). Open circles: less-affected side; filled circles: more-affected side. Open triangles: healthy subjects, combined hands. Regions: f: fingertip; p: palm; and d: dorsum. B) Correlation between fingertip and palm thresholds. The zone of impaired sensation is indicated by grey shading (fingertip 0.6 g, palm 1.0 g, see text for details). The left hand panel illustrates a significant positive correlation between the fingertips and palm thresholds for the more-affected side (rs(40) = 0.79, p<0.001); the right hand panel illustrates the correlations for the less-affected side (rs(40) = 0.58, p<0.001), and healthy subjects (rs(34) = 0.64, p<0.001). rs = correlation co-efficient (degrees of freedom).

