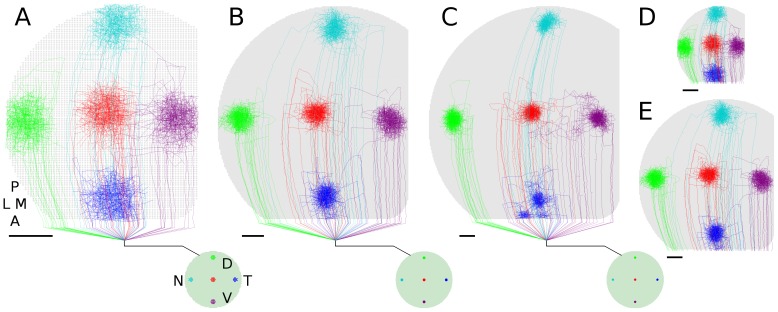
Figure 7. Arborization size relative to collicular area.
Relative size of axon arbors to collicular area changes with colliculus size when collicular cell density is held constant (scale bars = 100 ). All colliculi scaled to same display size to show relative arbor coverage. Colliculi have 6772 cells (A, 2515 RGCs), 25K cells (B, 10K RGCs) and 50K cells (C, 20K RGCs). All results shown are based on the same simulation parameters, other than number of RGCs and collicular cells.
  ,
, , Same colliculi in (A) and (B), respectively, shown to same scale of (C). Simulation results can thus be influenced by the number of neurons represented, indicating that the scale of a computational model can influence its quantitative results.

