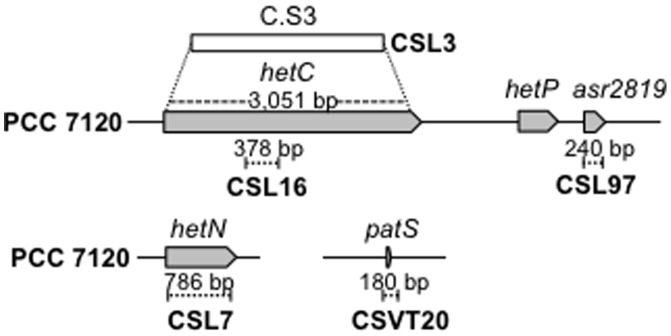
Figure 1. Schematics of the hetC, hetN and patS genomic regions in Anabaena sp. strain PCC 7120 and mutant derivatives.

The gene map is from [38]. The Anabaena genes are represented with grey arrows, the deleted portions (of the specified sizes) with dashed segments, and C.S3 gene-cassette insertion with a white bar. The names of the resulting mutant strains in the wild-type genetic background are indicated.
