
Figure 3. BMI z-score in relation to urinary phthalate metabolite concentrations, by median (ppb) quartiles for ∑All in 8-10yrs boys (A), MBP and ∑LMP in 11-13yrs boys (B), and ∑MEHP in 8-10yrs girls (C).
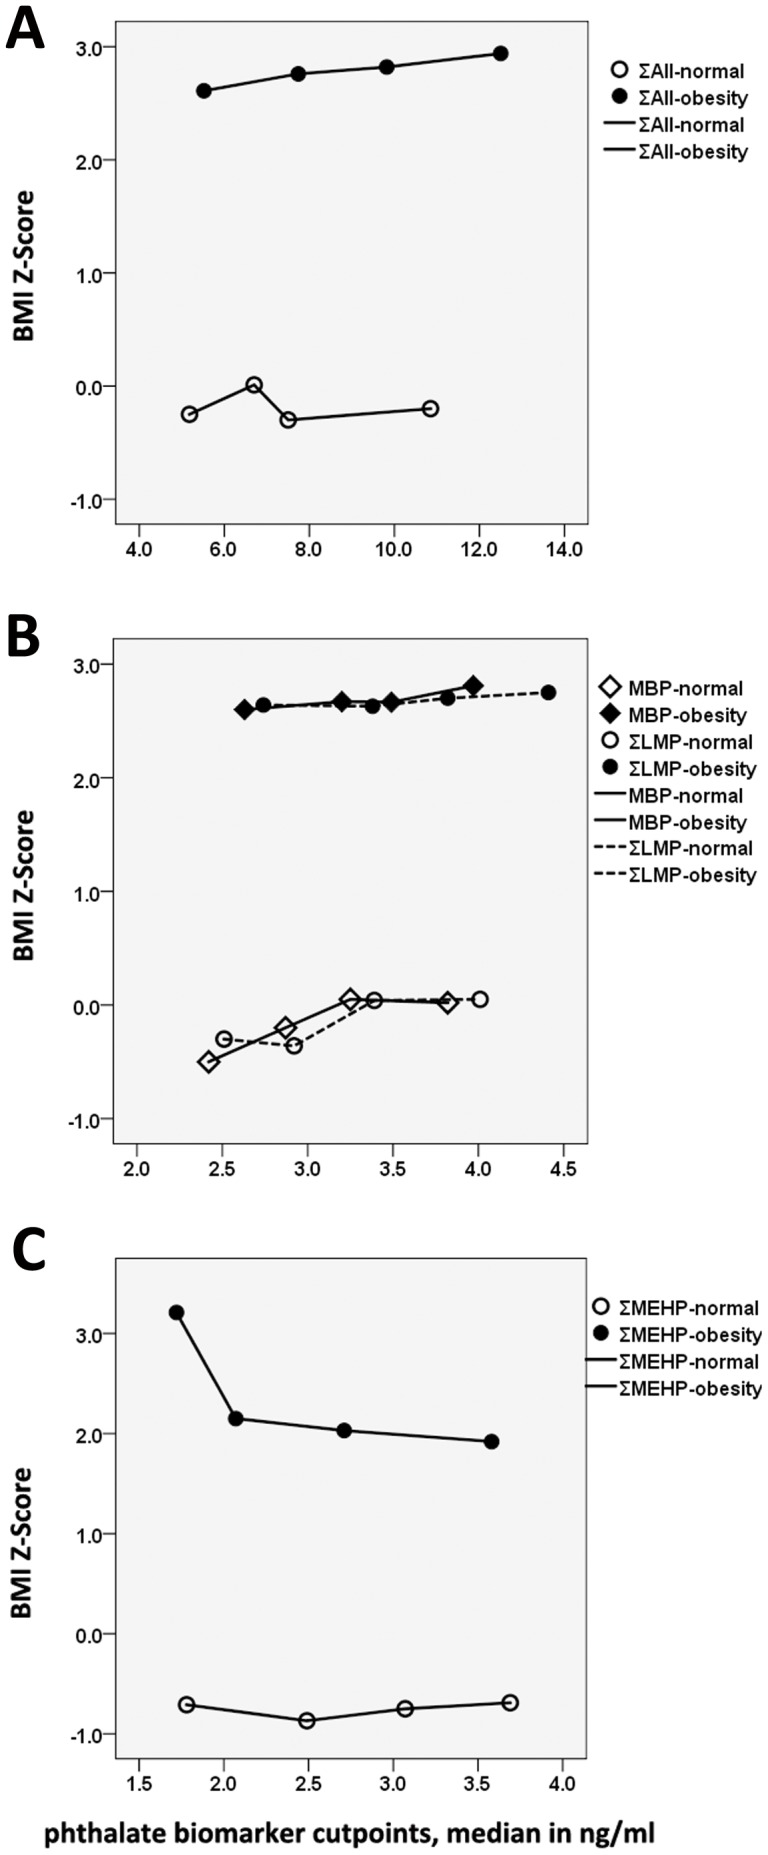
Obesity and normal weight children were stratified by age- and gender-specific weight distribution based on the national survey in Chinese school children, normal weight children (<80th %) and obesity children (≥90th%), National Puberty Timing and Health Effects in Chinese Children (PTHEC) study, Shanghai 2010-2012.