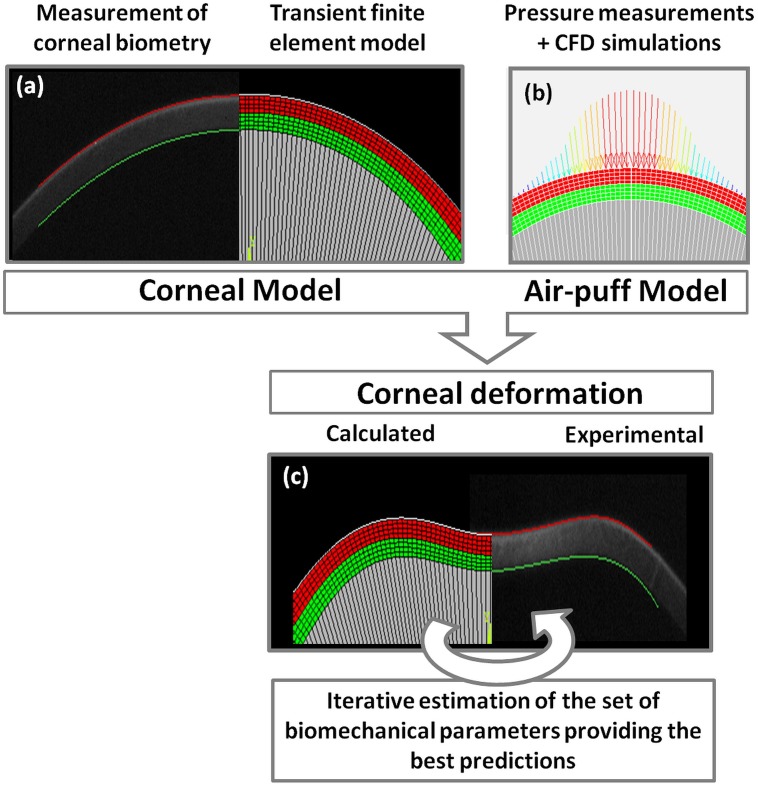
Figure 1. Schematic illustration of the simulation procedure.
(a) Corneal geometrical data from Scheimpflug images are used to define the model geometry. Inverse modeling is performed to account for the effect of applying the IOP. (b) The temporal pressure profile measured experimentally and the spatial pressure profile obtained from CFD (Computation Fluid Dynamics) simulation are applied to the cornea as a function of time, location and current deformed shape. (c) The finite element model is solved for the current parameter set and simulation results are compared to the experimentally measured deformation. A step-wise optimization approach is used to find the parameter set that leads to the most similar deformation.

