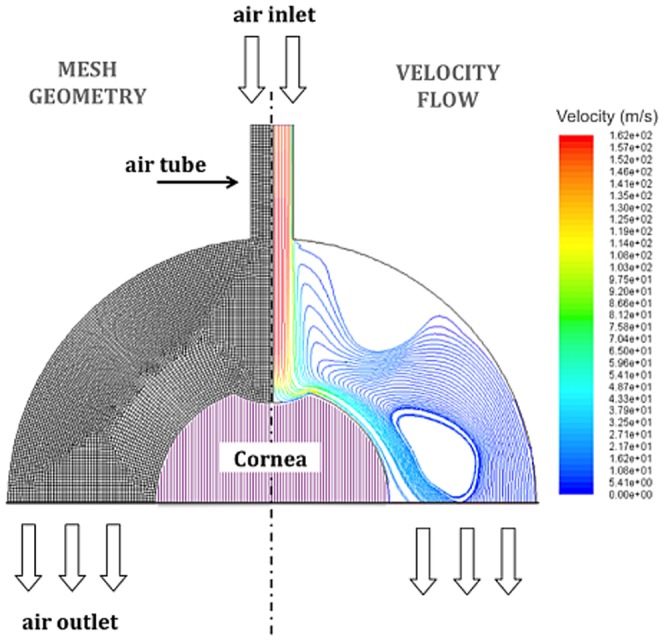
Figure 3. Geometry model of the cornea at maximal deformation.

Mesh of cells of the modeled air volume (left) and streamlines (right) colored by the flow velocity distribution.

Mesh of cells of the modeled air volume (left) and streamlines (right) colored by the flow velocity distribution.