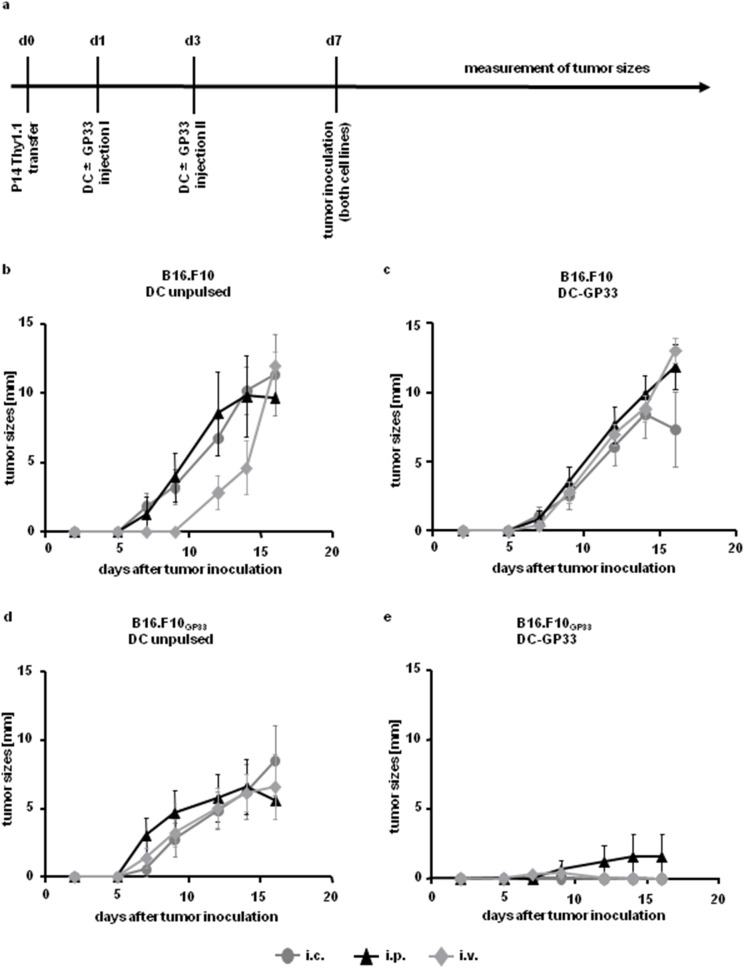
Figure 1. Tumor growth after T cell transfer and repeated DC vaccination via different injection routes.
Time axis of experimental set up (a). 1.5×10⁶ Thy1.1+ P14 splenocytes were adoptively transferred i.v. into C57BL/6 (Thy1.2+) mice. One and three days later 3×10⁶ BM-DC, either pulsed (c & e) or left unpulsed (b & d) were injected (i) intracutaneously (i.c.) (grey cycles), (ii) intraperitoneally (i.p.) (black triangles) or (iii) intravenously (i.v.) (grey diamonds). On day seven after P14 transfer 1×10⁶ cells of the melanoma cell lines B16.F10 (b & c) and B16.F10GP33 (d & e) were inoculated subcutaneously (s.c.) into the left and the right flank, respectively. Every second day tumor sizes were measured. Tumor diameters are depicted. Three independent experiments were performed with 4 mice in each group. Error bars: SEM.

