
Figure 2.
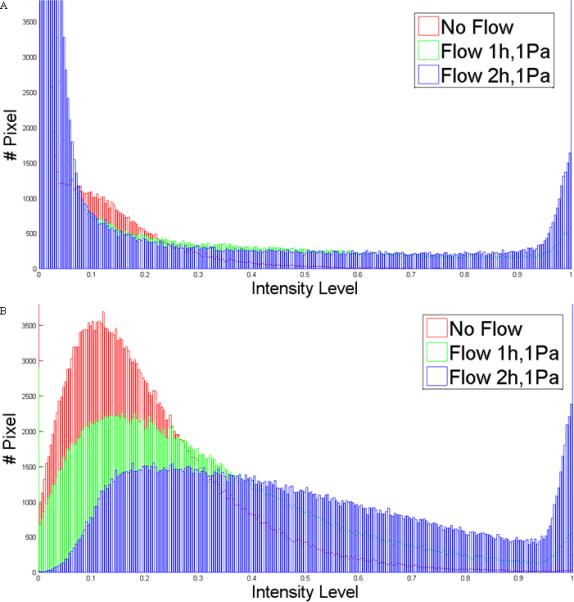
Distribution of intensity in images of three different conditions: no flow, flow 1h,1Pa and flow 2h,2Pa for MLO-Y4 (A) and IMCD-SSTR3 (B). A higher intensity value means a higher amount of polymerized β-tubulin which corresponds to a denser microtubule network.